#NJ #COVID19
Haven't updated these in a while. These will be Cases/Hospitalizations/Deaths on a raw basis by age group, and then Cases/Hospitalizations/Deaths on a percent basis by age group
First up, raw 7d avg cases by age group. Cases driven by overtesting 30-49 and 0-17
/1
Haven't updated these in a while. These will be Cases/Hospitalizations/Deaths on a raw basis by age group, and then Cases/Hospitalizations/Deaths on a percent basis by age group
First up, raw 7d avg cases by age group. Cases driven by overtesting 30-49 and 0-17
/1

Second, raw 7d avg Hospitalizations by age group. No surprises here, still being driven by older age groups. At the same case rate during the 2020 Winter wave, hospitals were slightly lower in most age groups.
/2
/2

Third, raw 7d avg Deaths by Age group. Again, no surprises. We've been sustaining flat death rates since the summer wave, no doubt this will go higher in the coming weeks.
Those under 50 look to have seen no improvement in the post vax era. (Not worse, either)
/3
Those under 50 look to have seen no improvement in the post vax era. (Not worse, either)
/3

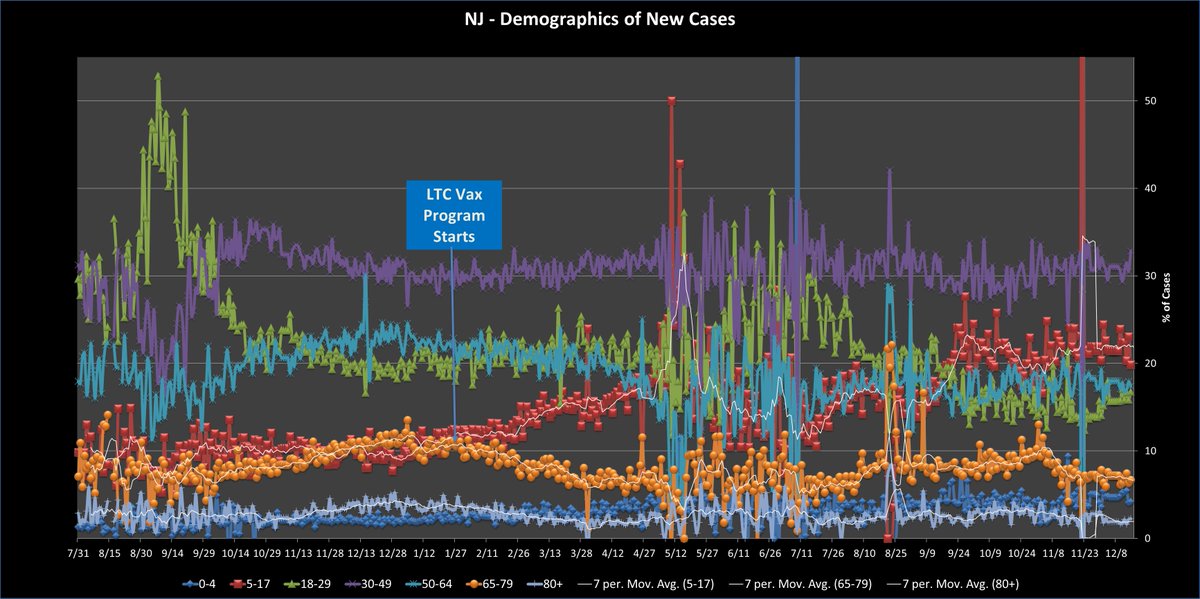
Next up, Raw Cases as a % of total cases per age group. Biggest changes here are doubling of 0-17 (from 10 to 20% of cases). This is no doubt attributable to increased testing on school kids.
This has not led to increased hospitalization/death in this age group.
/4
This has not led to increased hospitalization/death in this age group.
/4

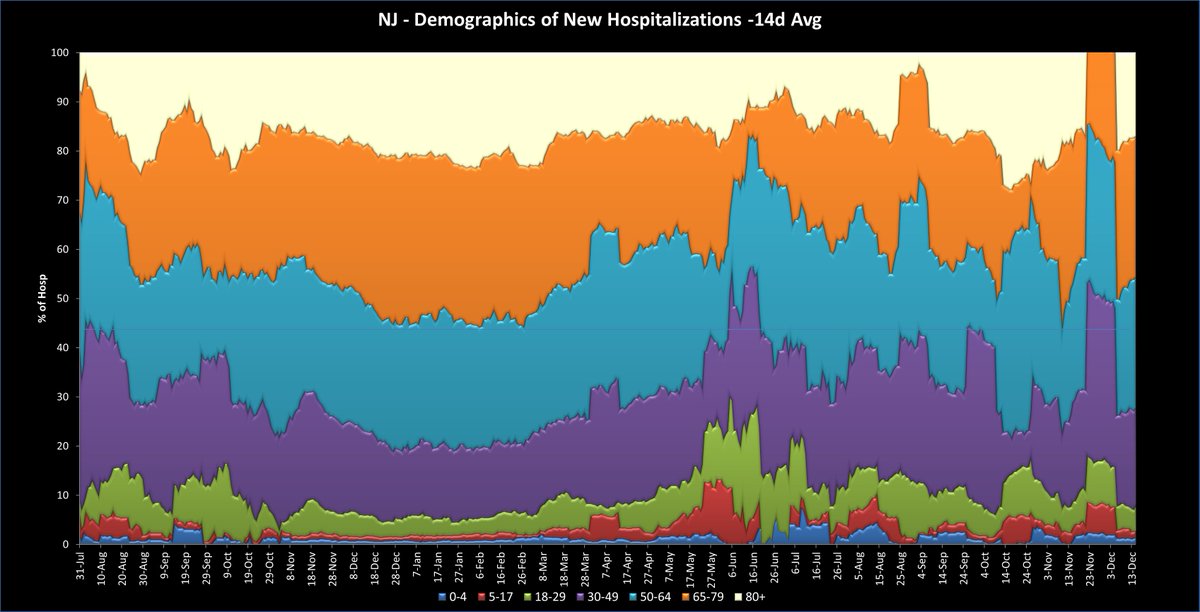
On 14d avg hospitalizations as a % of total hospitalizations, you can see no real movement throughout the pandemic. 65+ hospitalizations did decrease with vaccine rollout but have given up those benefits. 0-17 very small % of all hospitalizations, even with increased testing
/5
/5

Finally, 14d avg of deaths as % of total deaths. As with hospitalizations, this hasnt moved much over the entire pandemic, and despite vaccines. The age group breaktouts are relatively unchanged (Maybe slight tick up in 50-64 over the pandemic)
0-29 yr olds remain low/0.
/e
0-29 yr olds remain low/0.
/e

• • •
Missing some Tweet in this thread? You can try to
force a refresh


