
#US #COVID19 The next time people tell you that Covid is affecting kids, keep these deaths in mind.
All are pulled from the WONDER database, none have Covid as an underlying cause of death:
wonder.cdc.gov/controller/dat…
A thread
🧵
All are pulled from the WONDER database, none have Covid as an underlying cause of death:
wonder.cdc.gov/controller/dat…
A thread
🧵
Newborn affected by a maternal infection and parasitic disease. 10 deaths, all in newborns. Counted as Covid 

Sudden Infant Death Syndrome. 5 deaths. All under 1 yrs old. Counted as Covid

Birth Asphyxia. 3 deaths. All newborns. 3 deaths. Counted as Covid

Respiratory Distress Syndrome. All newborns. 3 deaths. Counted as Covid

Brain cancer. 3 Deaths in 17 yr olds. Counted as Covid

Overdose on Narcotics. 3 deaths in 17 yr olds. Counted as Covid

Intracranial hemorrhage. 2 deaths. Both under 1 yrs old. Counted as Covid

Newborn affected by rupture of membranes. 2 deaths, both newborns. Counted as Covid.

Newborn affected by other forms of placental separation. 2 deaths, both newborns. Counted as Covid

Intrauterine hypoxia. 2 deaths, both newborns. Counted as Covid.

Neonatal Cardiac Failure. 2 deaths. Both newborns. Counted as Covid.

Hypoxic ischemic encephalopathy. 2 deaths. Both newborns. Counted as Covid.

Congenital Malformation of the Heart. 2 deaths. Both under 1 yr old. Counted as Covid.

Edwards Syndrome. 2 deaths, Both under 1 yr old. Counted as covid.
"Edwards' syndrome affects how long a baby may survive. Sadly, most babies with Edwards' syndrome will die before or shortly after being born. "
"Edwards' syndrome affects how long a baby may survive. Sadly, most babies with Edwards' syndrome will die before or shortly after being born. "

Person injured in unspecified Motor Vehicle Accident. 2 deaths. Both 17 yrs old. Counted as Covid.

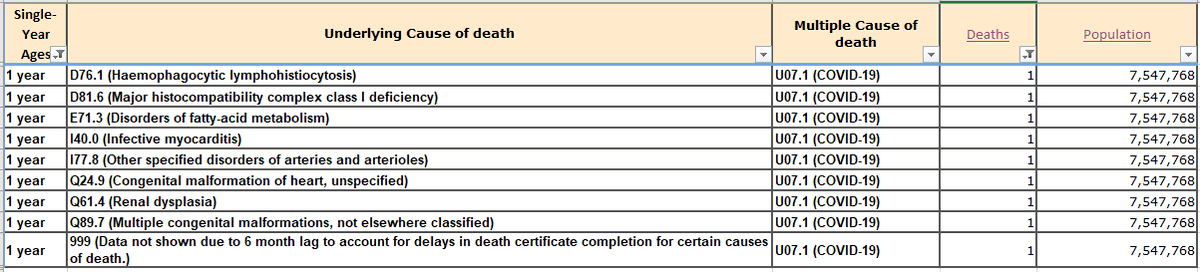
Here are the other causes of death resulting in 1 death per code. All under 1 yrs old.
Heart failures, Bacterial infection, Poisoning, placental disorders, complications from L&D.
26 deaths. All counted as Covid.
Heart failures, Bacterial infection, Poisoning, placental disorders, complications from L&D.
26 deaths. All counted as Covid.

1 death per code, all 1 yrs of age.
Majority are birth defects, liver/heart/kidneys
9 deaths. All counted as covid.
Majority are birth defects, liver/heart/kidneys
9 deaths. All counted as covid.
1 death per code, ages 2 through 5.
Cancers, birth defects, brain hemorrhages.
7 deaths total. All counted as covid.
Cancers, birth defects, brain hemorrhages.
7 deaths total. All counted as covid.

1 death per code, ages 6 through 9,
Epilepsy, drowning, brain cancer, blood cancer, birth defects, mononucleosis.
17 deaths total. All counted as covid
Epilepsy, drowning, brain cancer, blood cancer, birth defects, mononucleosis.
17 deaths total. All counted as covid

1 death per code, ages 10 through 13.
diabetes, leukemia, foreign body entering through the eye, epilepsy, accidents, drowning, Patau syndrome.
27 deaths total. All counted as Covid
diabetes, leukemia, foreign body entering through the eye, epilepsy, accidents, drowning, Patau syndrome.
27 deaths total. All counted as Covid

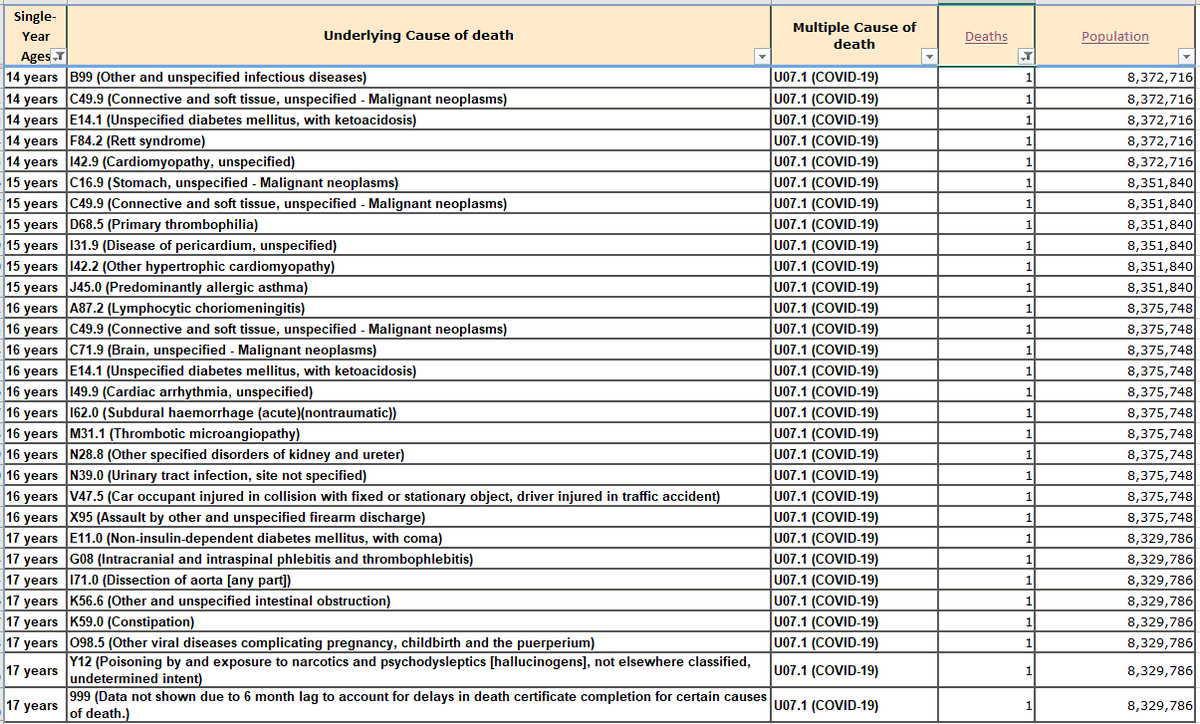
1 death per code. ages 14 through 17.
Stomach Cancer, Rett's syndrome, genetic disorders, diabetes, Brain caner, leukemia, constipation(!!), Aorta dissection, car accident, UTI, Poisoning.
30 deaths total. All counted as Covid
Stomach Cancer, Rett's syndrome, genetic disorders, diabetes, Brain caner, leukemia, constipation(!!), Aorta dissection, car accident, UTI, Poisoning.
30 deaths total. All counted as Covid
In total, 169 of the 632 listed deaths in kids 17 or under likely have NOTHING to do with covid, but are counted as a covid death. Imagine if we had access to audit the other 463?
Sadly, children have died from covid. But it's rare, and its rarer than we're being led to believe.
Sadly, children have died from covid. But it's rare, and its rarer than we're being led to believe.
• • •
Missing some Tweet in this thread? You can try to
force a refresh


