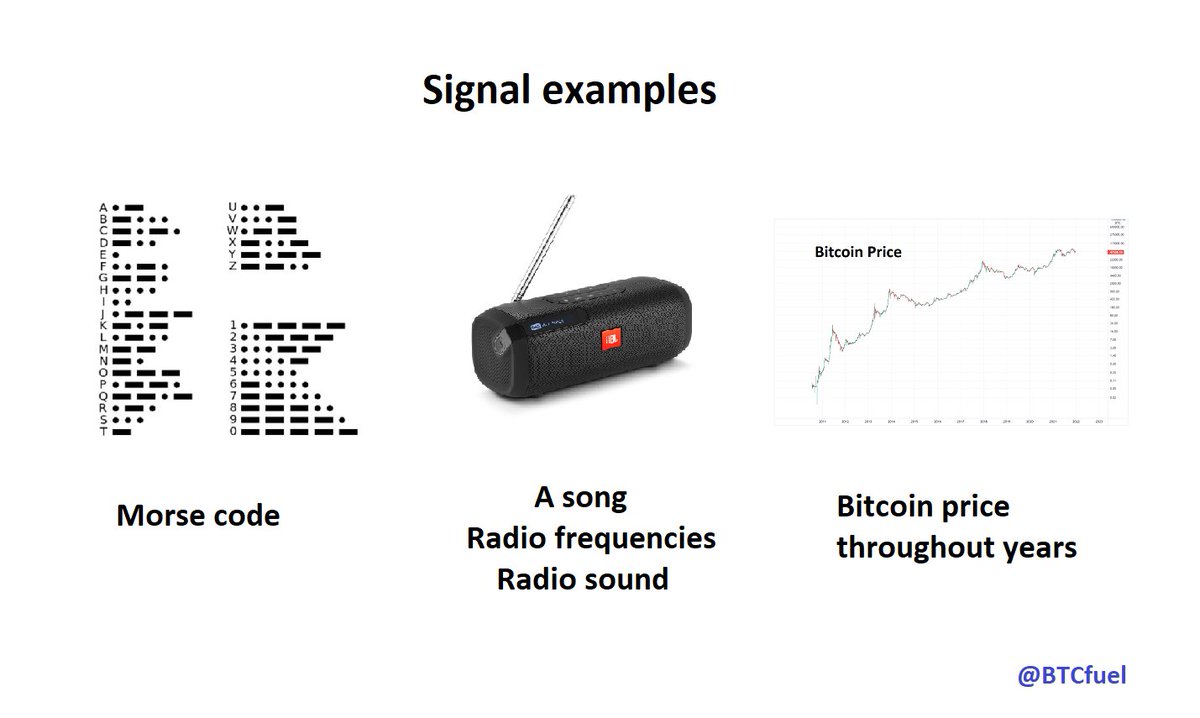
1/16 Understanding signal and its energy
In this thread I explain in an easy way the importance of understanding signal and its energy. Conceptual thinking in terms of signal and energy will give you deeper understanding of Bitcoin, the (crypto) markets and indicators
In this thread I explain in an easy way the importance of understanding signal and its energy. Conceptual thinking in terms of signal and energy will give you deeper understanding of Bitcoin, the (crypto) markets and indicators

2/16 What is a signal actually?
A good definition for a signal is: “meaningful information that you are trying to detect”
The part that is not signal, one calls noise: “random, unwanted variation or fluctuation that interferes with the signal”
A good definition for a signal is: “meaningful information that you are trying to detect”
The part that is not signal, one calls noise: “random, unwanted variation or fluctuation that interferes with the signal”

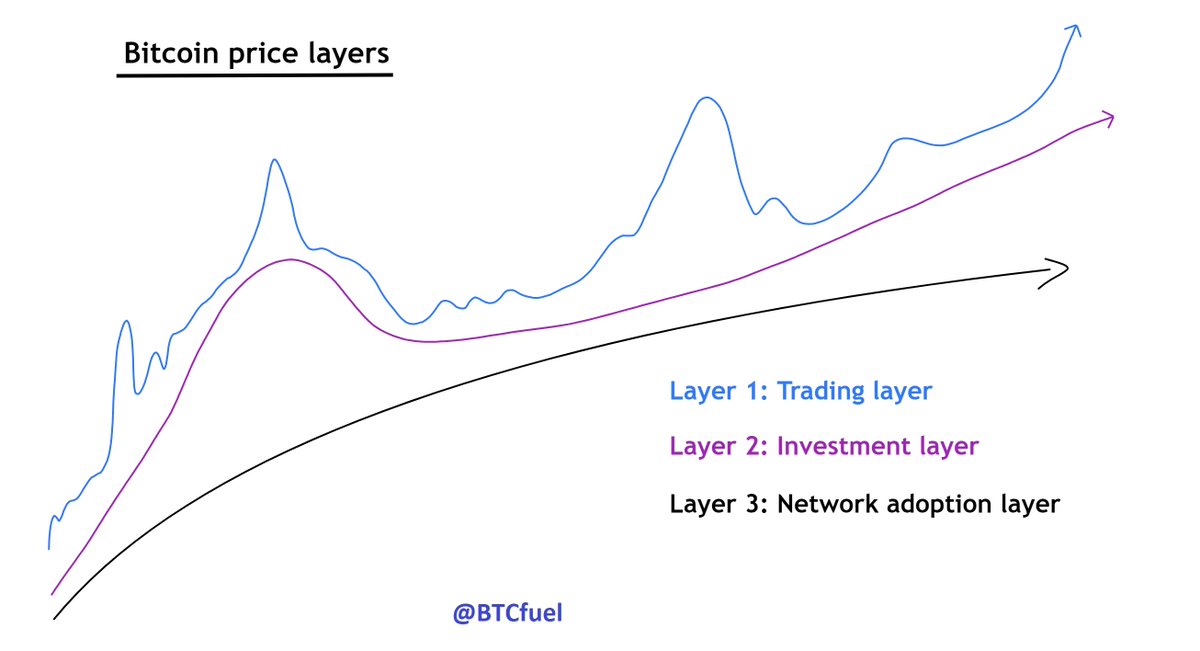
4/16 A signal is a very relative concept. Take for example the Bitcoin price. It really depends what meaningful information one is trying to detect. The Bitcoin price, a cycle or an impulse wave are all (raw) signals. A signal can consist of multiple smaller signals 

5/16 What a signal is in a certain case or problem can sometimes be ambiguous or unclear because you want to detect meaningful information but it’s not clear whether the information (data) you’re receiving is actually meaningful 

6/16 One uses filters to create better data by removing (a part of) the noise / not useful information. In a digital world, filters are mathematical operations on (raw) data 

7/16 In the scientific world, sine waves are often present. This is a general representation of a sine wave. The sine wave can be scaled or shifted on both x and y axis. The complete sine wave itself, A, B, C, D or sin(B(x+C)) can be “meaningful information to detect” = signal 

9/16 When doing an analysis in the markets, it is sometimes interesting to know what the magnitude of an impulse is. This is the formula for the energy of a real continuous signal in signal analysis: 

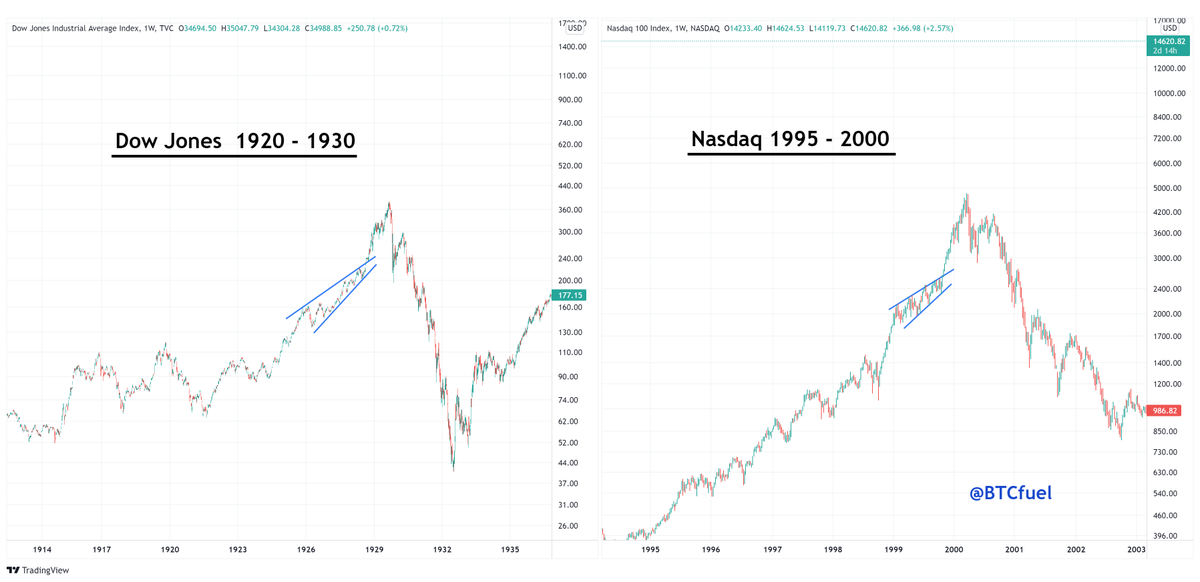
12/16 How I applied this to Bitcoin: I think each Bitcoin cycle has 4 impulse waves. These 4 impulse waves are distinguishable because of their unique shapes and always happen in a specific sequence. It’s the translation of “the Wall Street cheat sheet” for Bitcoin. 

13/16 Therefore it is one of the best indicators to roughly estimate the cycle top. Because it’s the result of the investment behavior of the masses over a long period of time which is on its turn the result of an information spreading pattern. Understanding structure is the key 

14/16 These 4 impulse waves are visible in the realized cap HODL waves indicator. The energy peaks of the HODL waves mean an increase in demand in a specific period. For Bitcoin, the amplitude is time dependent. Sometimes the impulse wave is less visible in this indicator (2016) 

15/16 Because the amplitude and energy of Bitcoin varies over time. Long term cycle top price forecasts solely based on amplitude or energy indicators like a Fibonacci extensions are therefore less reliable / unreliable compared to the 4 waves pattern
16/16 The end
• • •
Missing some Tweet in this thread? You can try to
force a refresh


