12/30 Texas C19 Update:
THREAD:
* A steep wave in regards to testing, cases and general hospitalizations, all of it in the Eastern half of the state
* Severe cases are lagging significantly behind
* Behaving like a summer wave, not at all like last winter
1/n
THREAD:
* A steep wave in regards to testing, cases and general hospitalizations, all of it in the Eastern half of the state
* Severe cases are lagging significantly behind
* Behaving like a summer wave, not at all like last winter
1/n
https://twitter.com/therealarod1984/status/1475927900239052804
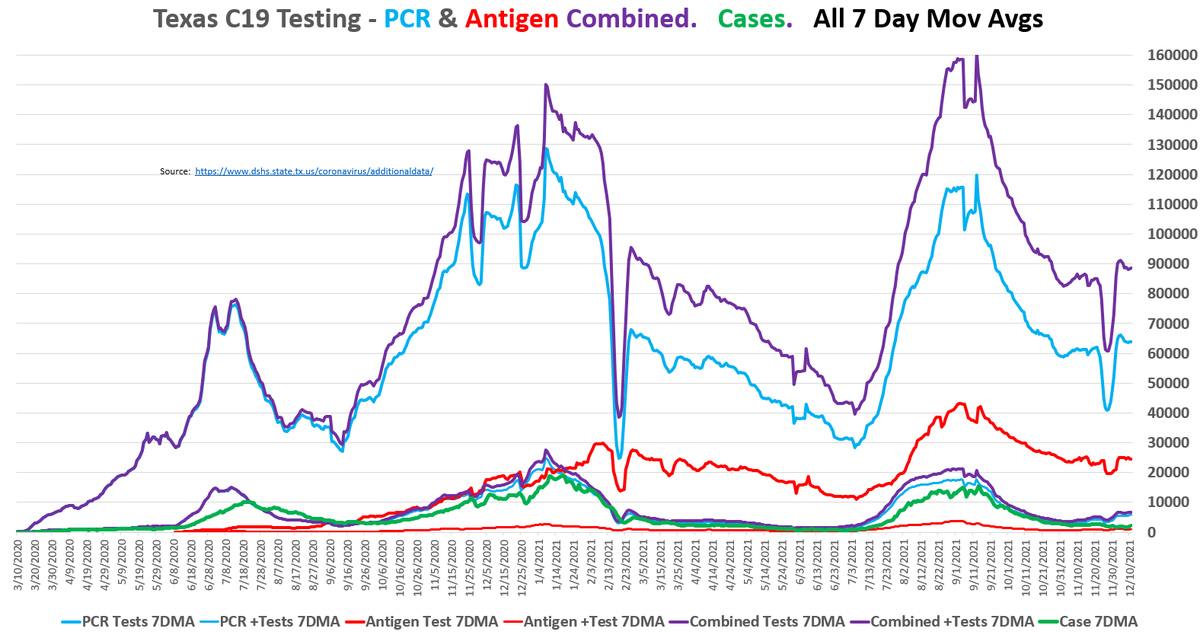
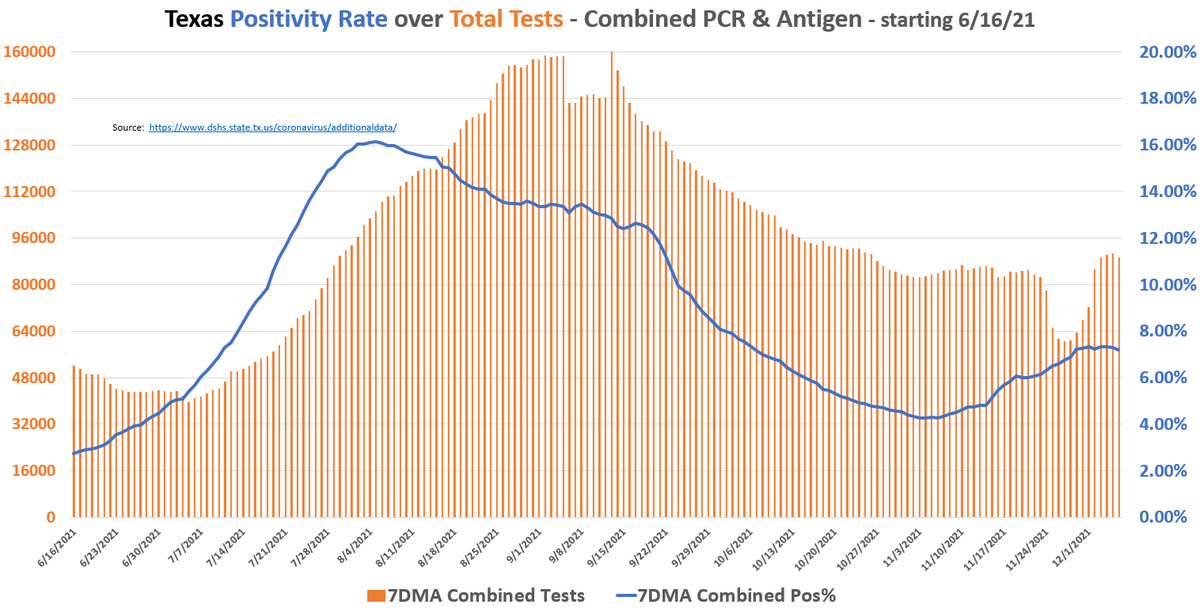
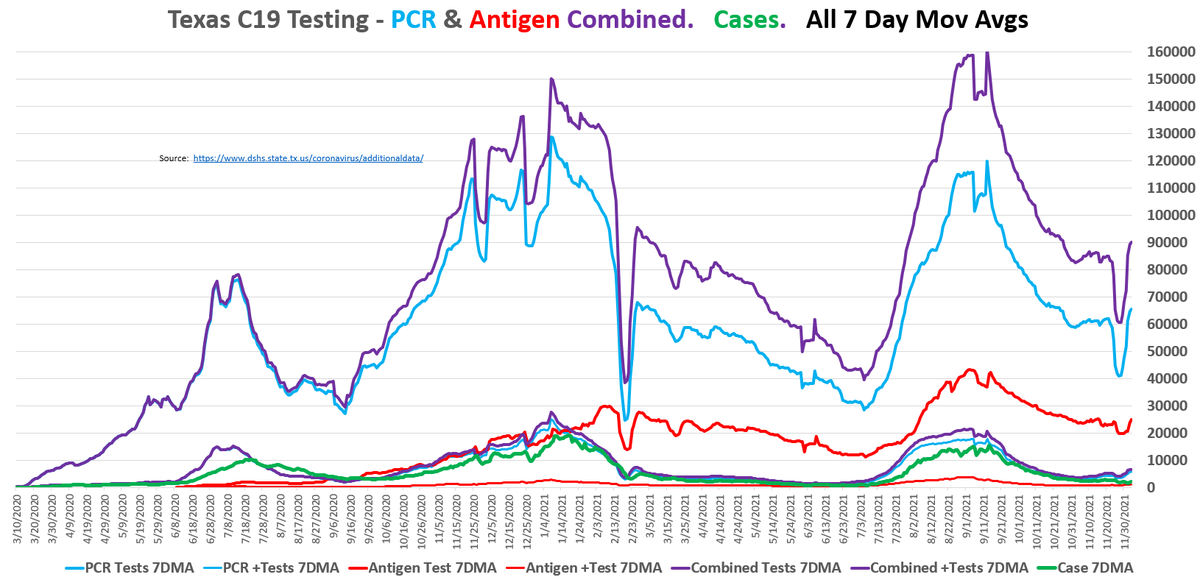
12/30 Testing
Tests filed by date of specimen collection, < 8 days old is incomplete
As of 12/20, a steep wave forming:
* Pos rate @ 12.57%, more growth to come
* Testing nearing 110K day
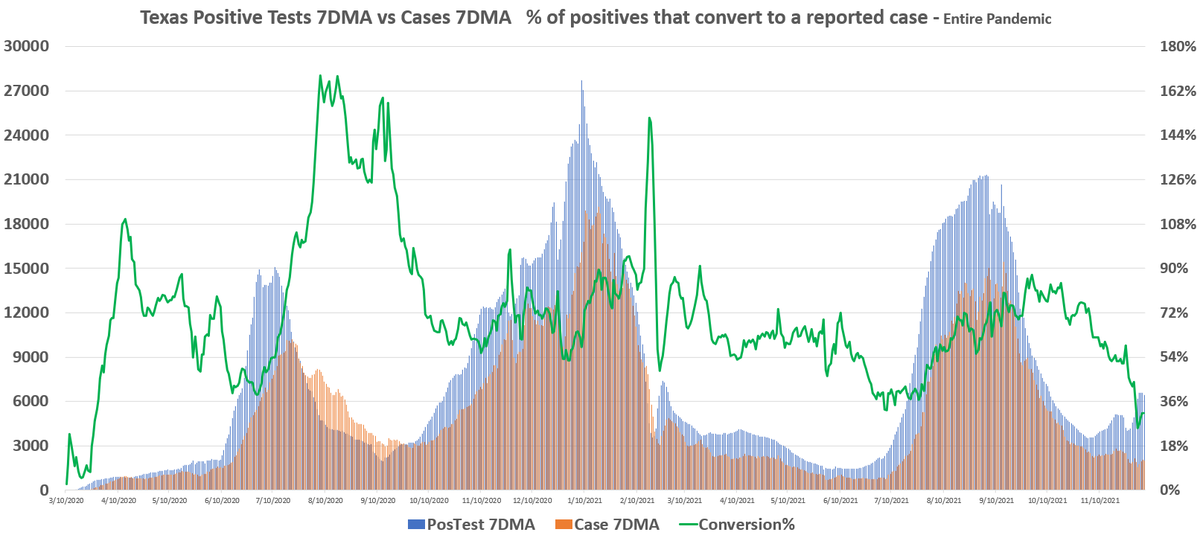
* Conversion of positives to cases will help to indicate where we are in the wave
2/n
.
Tests filed by date of specimen collection, < 8 days old is incomplete
As of 12/20, a steep wave forming:
* Pos rate @ 12.57%, more growth to come
* Testing nearing 110K day
* Conversion of positives to cases will help to indicate where we are in the wave
2/n
.


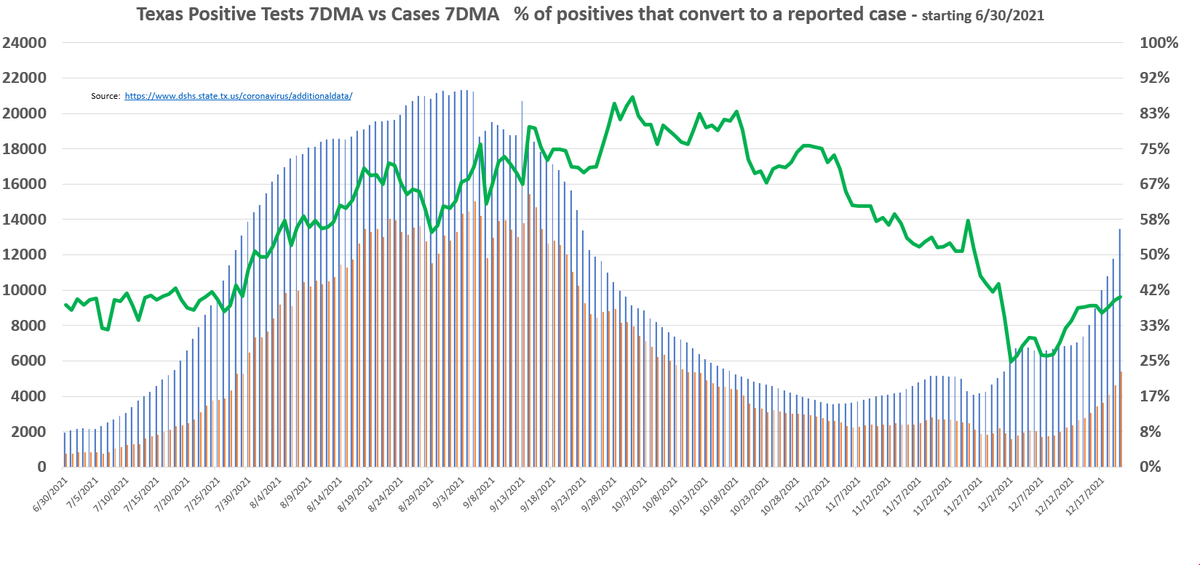

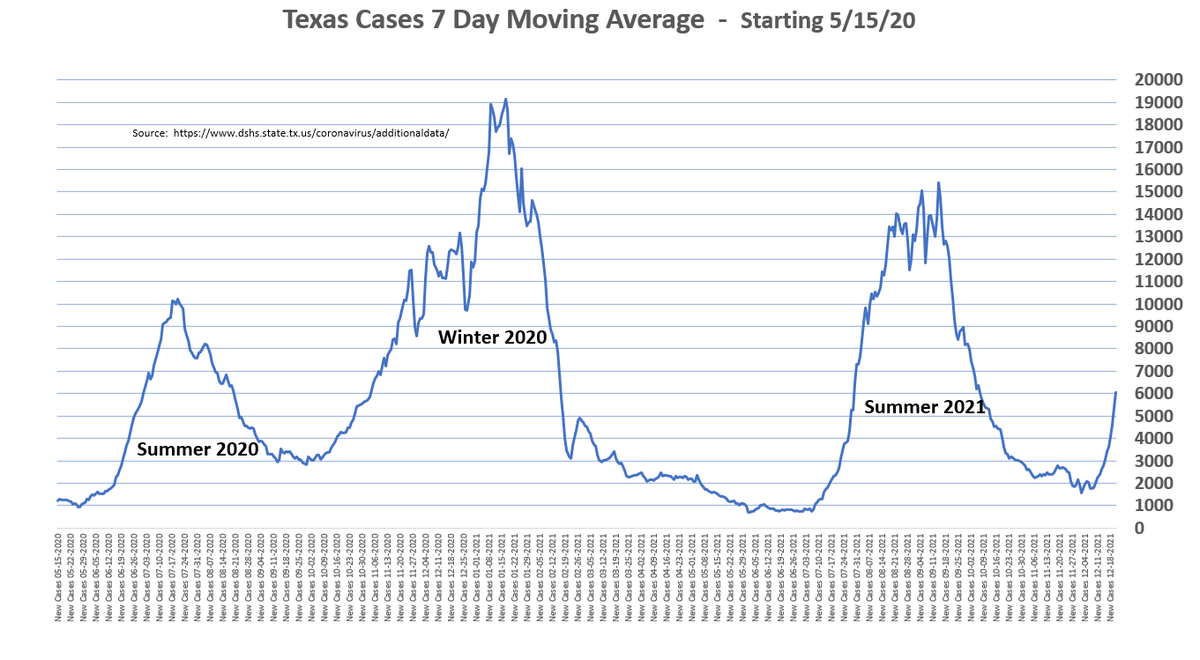
12/30 - Cases
* Cases are batched by date received by the county
* Growth rate is tapering, some of that may be due to the holiday
* More cases now than at this point in 2020 wave, which was much more steady and flat. This wave behaving like a Summer one.
3/n
.
* Cases are batched by date received by the county
* Growth rate is tapering, some of that may be due to the holiday
* More cases now than at this point in 2020 wave, which was much more steady and flat. This wave behaving like a Summer one.
3/n
.


12/30 Hospitalizations - Part 1
* % of beds tagged as Covid 9.02%, census at 4431.
* Admits 7DMA rising sharply to 846, indicating increased census in coming days
* General hospitalizations are really rising, but the same can't be said for ICU, yet...
4/n
.
* % of beds tagged as Covid 9.02%, census at 4431.
* Admits 7DMA rising sharply to 846, indicating increased census in coming days
* General hospitalizations are really rising, but the same can't be said for ICU, yet...
4/n
.


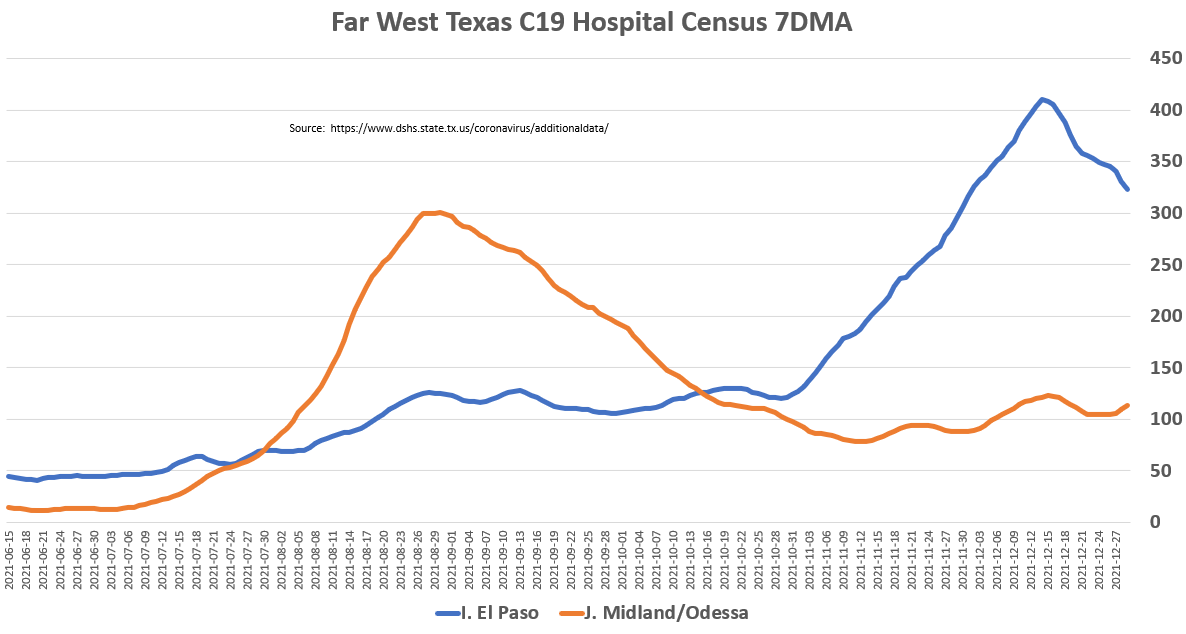
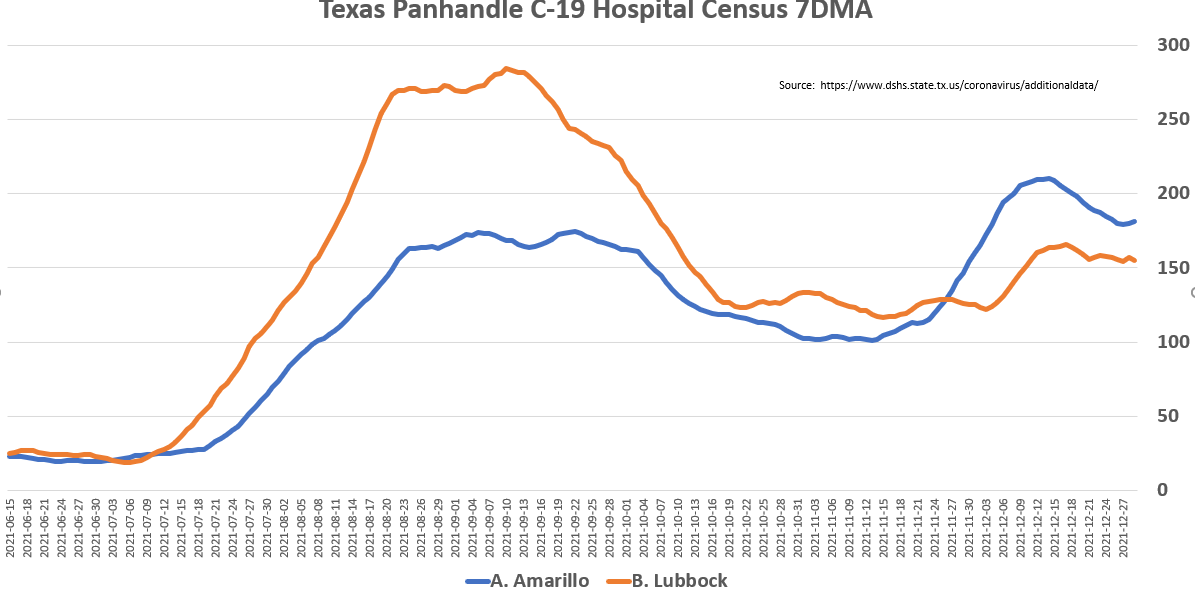
12/30 Hospitalizations - Part 2
* ICU portion of the bed census in a much more shallow rise at 1244
* We will watch this and vent usage in the coming days as indicator of severity
* Far West Texas and Panhandle are still not showing signs of renewed rise
5/n
.
* ICU portion of the bed census in a much more shallow rise at 1244
* We will watch this and vent usage in the coming days as indicator of severity
* Far West Texas and Panhandle are still not showing signs of renewed rise
5/n
.

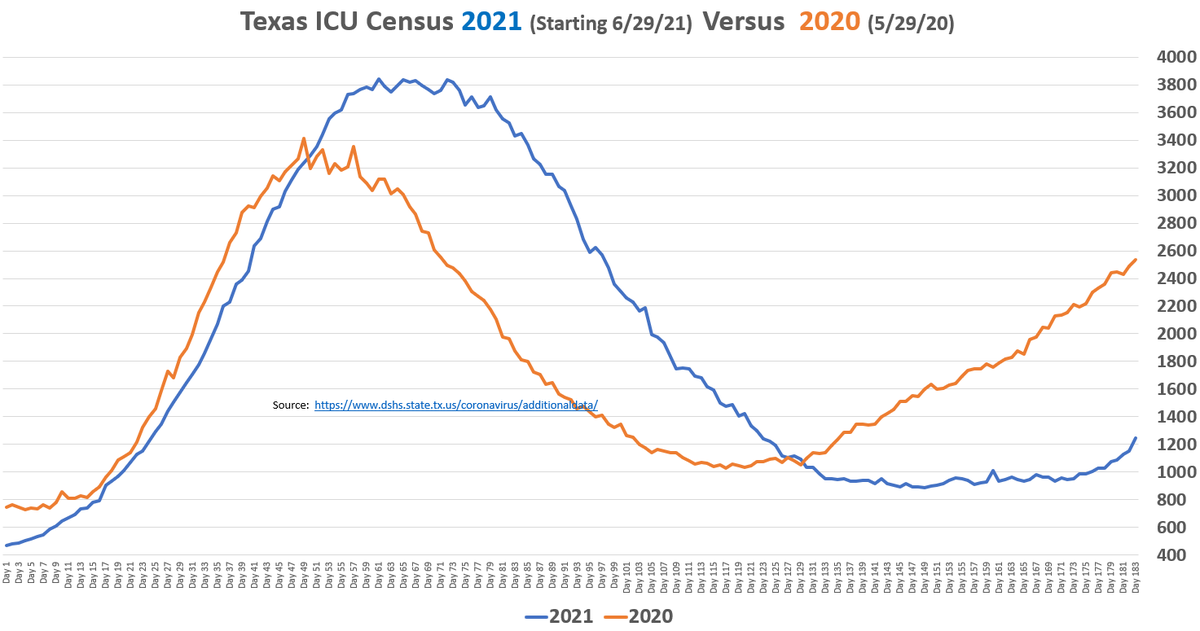

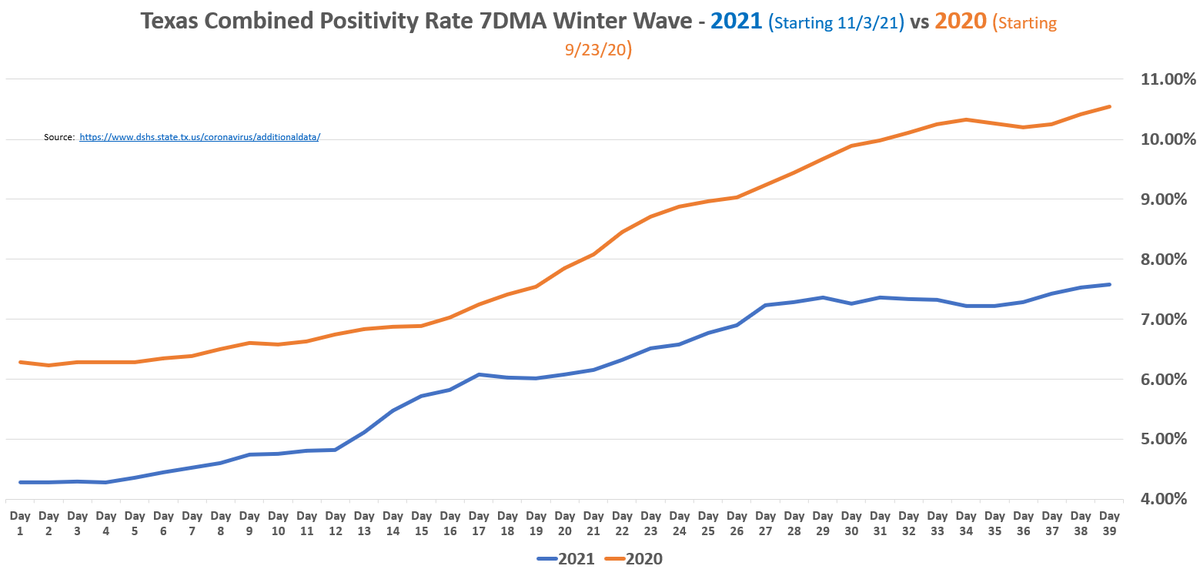
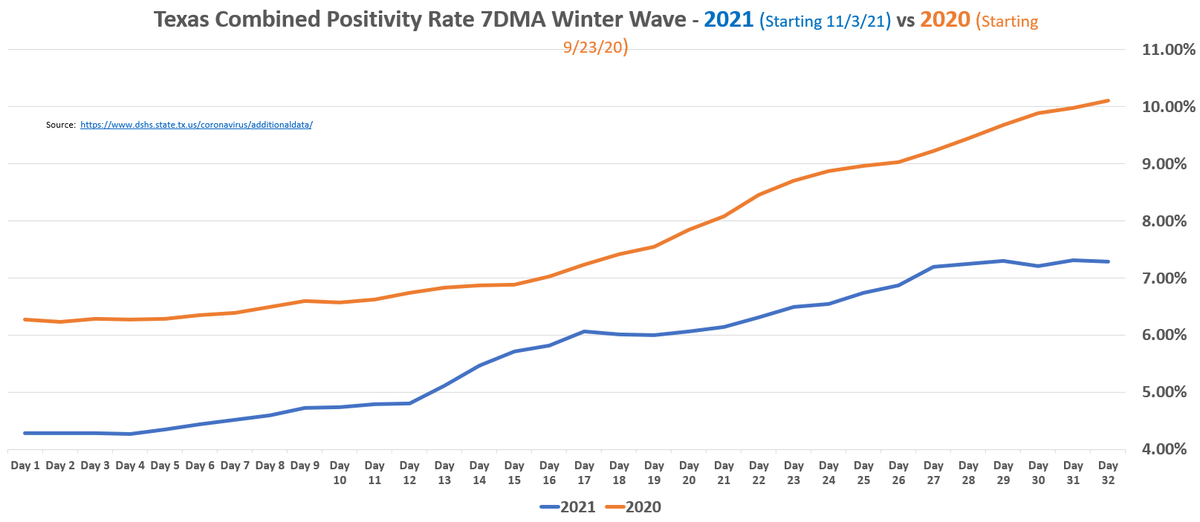
12/30 Conclusion
* Reminder- 20 vs 21 charts have "Day #" X axis, start dates in chart titles
* Winter Wave was really late but its here
* We have ~ 3-4 weeks of rise ahead in the Texas Metro Triangle and far East & South Texas
* We will soon know how severe it is
.
6/end
* Reminder- 20 vs 21 charts have "Day #" X axis, start dates in chart titles
* Winter Wave was really late but its here
* We have ~ 3-4 weeks of rise ahead in the Texas Metro Triangle and far East & South Texas
* We will soon know how severe it is
.
6/end
• • •
Missing some Tweet in this thread? You can try to
force a refresh