12/30 Texas Regional C19 Hospitalization Analysis:

THREAD:

* Breakdown of the numbers into the different regions
* Far West & Panhandle basically are done with their wave
* Wave has moved East and South, and obviously into Texas Metro Triangle now, which will drive numbers

1/n
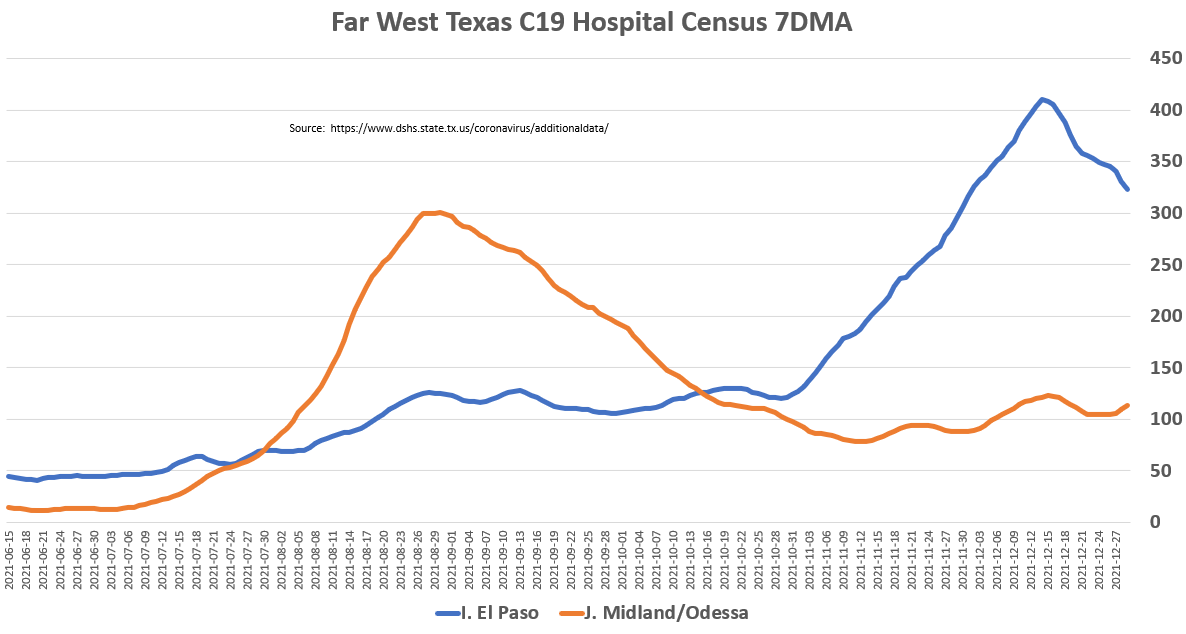
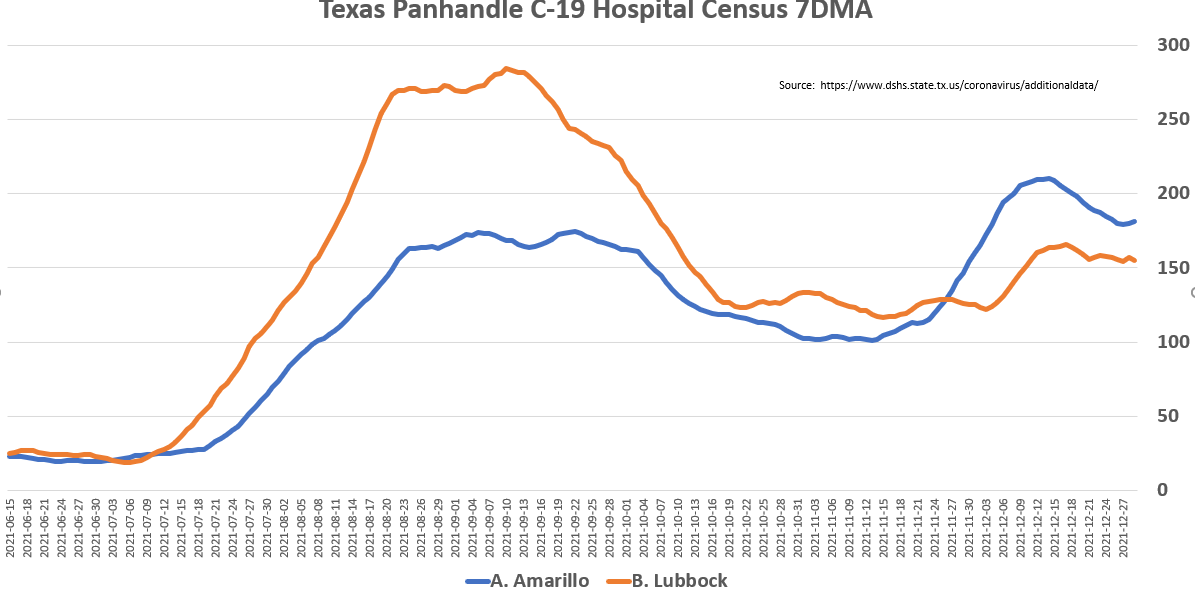
12/30 TX Regional Analysis: Far West and Panhandle

* El Paso appears completely over
* Midland some cyclical minor growth
* Amarillo & Lubbock are flat & whatever growth there is is cyclical
* For now, the wave has moved through this area and its over. Well watch though

2/n ImageImageImageImage
12/30 TX Regional Analysis: Texas Metro Triangle

* Austin and San Antonio have just started their rapid ascent.
* Dallas is also in the middle of rapid growth
* Houston has been driving the numbers, but the growth rate will soon taper. That's just how this works.

3/n ImageImageImageImage
12/30 TX Regional Analysis: Other Texas Regions Pt 1

* Moving from West to East & then South
* West Texas showing some very moderate growth
* Same with Central
* Northeast Texas still really flat. Tyler maybe starting some moderate growth

4/n ImageImageImage
12/30 TX Regional Analysis: Other Texas Regions Pt 2

* Galveston in a similar rise to Houston, just on a smaller scale obviously
* Some minor growth in LRGV and South Texas, but that area has been hit the hardest and has the least room for a wave. We will see.

5/n ImageImage
12/30 TX Regional Analysis: Conclusion

* The wave moved Northwest to Southeast as predicted a month ago by me and others.
* We've got 3-4 weeks of this wave to ride out, so hang on.
* Happy New Year!
* May 2022 be the year this finally ends (maybe by November!)

6/end

• • •

Missing some Tweet in this thread? You can try to force a refresh
 

Keep Current with therealarod1984

therealarod1984 Profile picture

Stay in touch and get notified when new unrolls are available from this author!

Read all threads

This Thread may be Removed Anytime!

PDF

Twitter may remove this content at anytime! Save it as PDF for later use!

Try unrolling a thread yourself!

how to unroll video
  1. Follow @ThreadReaderApp to mention us!

  2. From a Twitter thread mention us with a keyword "unroll"
@threadreaderapp unroll

Practice here first or read more on our help page!

More from @therealarod1984

30 Dec 21
12/30 Texas C19 Update:

THREAD:

* A steep wave in regards to testing, cases and general hospitalizations, all of it in the Eastern half of the state
* Severe cases are lagging significantly behind
* Behaving like a summer wave, not at all like last winter

1/n
12/30 Testing

Tests filed by date of specimen collection, < 8 days old is incomplete

As of 12/20, a steep wave forming:
* Pos rate @ 12.57%, more growth to come
* Testing nearing 110K day
* Conversion of positives to cases will help to indicate where we are in the wave

2/n
. ImageImageImageImage
12/30 - Cases

* Cases are batched by date received by the county
* Growth rate is tapering, some of that may be due to the holiday
* More cases now than at this point in 2020 wave, which was much more steady and flat. This wave behaving like a Summer one.

3/n
. ImageImageImageImage
Read 6 tweets
22 Dec 21
12/21 - TX Hospitalizations by Region

THREAD:

* Analysis of 22 Texas TSA Hospital Regions grouped into 8 regional charts
* The Western part of the state has peaked for now. Will it stay that way? If so, not much of a wave
* Only new TX growth is in Houston

1/n
.
Panhandle and Far West Texas

* Start Date on all Charts is Jun 1
* Census for all four TSAs are in decline, as is change in 7DMA
* El Paso & Amarillo is in strong decline, which mirrors case rates in New Mexico
* Are these areas post peak or another wave coming We'll see

2/n
.
Texas Metro Triangle

* Only Houston showing strong recent growth. HOU can make a big impact to state numbers if it starts to offset the declines in 2/n
* The other three metros are really flat. The RoG charts show wave patterns that could indicate some growth is coming?

3/n
.
Read 4 tweets
21 Dec 21
12/21 Texas C19 Update: On the Case

THREAD:

* Testing showing signs of growth
* Cases finally climbing pretty fast as expected
* Case growth will taper soon but continue steadily
* Hospitalizations still flat as can be
* "Winter Wave 2021" right now is a casedemic

1/n
12/21 Testing

Tests filed by date of specimen collection, < 8 days old is incomplete

As of 12/11:
* Pos rate @ 7.57%
* Testing was still < 90K/day, but coming days will show growth, as will pos rate
* Conversion of positives to cases finally increasing, hence the cases

2/n
. ImageImageImageImage
12/21 - Cases

* Cases are batched by date received by the county
* Winter 2021 cases playing a ton of catch up with positive tests, growth will slow soon
* Vs Winter 2020, while its catching up to the 7DMA, obviously a ton more cases to start the 2020 Winter wave

3/n
. ImageImageImageImage
Read 6 tweets
19 Dec 21
12/19 Texas C19 Update: Casedemic

THREAD:

* Cases finally coming in after lagging way behind positive tests
* SE Texas is showing some spread, while W Texas is post peak
* Statewide testing and hospitalizations still flat as can be
* "Winter Wave 2021" is still a misnomer

1/n
12/19 Testing

Tests filed by date of specimen collection, < 8 days old is incomplete

As of 12/9:
* Pos rate @ 7.42%
* With Testing flat @ 90K/day, means Positives are flat
* But historically low conversion of positives to cases means lots of cases out there

2/n
.
12/19 - Cases

* Cases are batched by date received by the county
* Winter 2021 cases finally showing up, but until positives jump, cases will likely flatten.
* While cases are rising, hospitalizations are flat as a pancake as the next 2 slides will show

3/n
.
Read 6 tweets
16 Dec 21
12/16 Texas C19 Update: Still Waiting

THREAD:

* Cases finally starting to rise but growth may be short lived
* Houston may be percolating, while ELP & AMA have peaked
* Widespread immunity? Looks that way right now
* Winter 2020 wave continues to leave 2021 in the dust

1/n
12/16 Testing

Tests filed by date of specimen collection, < 8 days old is incomplete

As of 12/6:
* Pos rate flat @ 7.20% & will stay flat for a few days
* With Testing flat @ 90K/day, means Positives are flat
* New Chart comparing Positives to Cases!
* Covidestim Rt 1.18

2/n
. ImageImageImageImage
12/16 - Cases

* Cases are batched by date received by the county
* Winter 2021 in a slow climb, but likely flattening in coming days.
* 2nd new chart comparing Positives to Cases, this one for the entire pandemic. Positives lead, then Cases, then conversion % trails

3/n
. ImageImageImageImage
Read 6 tweets
14 Dec 21
12/14 Texas C19 Update: Bag o' Nothing

THREAD:

* Feel like I'm waiting on a wave that isn't coming
* Paddling on my surfboard in a calm ocean, might be time to paddle to shore and go home
* Widespread immunity? Starting to look that way
* Winter 2021 vs 2020 LOL

1/n
12/14 Testing

Tests filed by date of specimen collection, < 7-8 days old is incomplete

As of 12/4:
* Positivity rate really flattening, at 7.29%. Upcoming days are same
* Testing starting to flatten ~90K per day
* Cases will start flattening as well
* Covidestim Rt 1.18

2/n
.
12/14 - Cases

* Cases are batched by date received by the county
* Winter 2021 in a slow climb, but likely flattening in coming days.
* 2021 Winter wave vs 2020, both positivity and cases, isn't comparable right now. -3 full points, and -3K cases.

3/n
.
Read 6 tweets

Did Thread Reader help you today?

Support us! We are indie developers!


This site is made by just two indie developers on a laptop doing marketing, support and development! Read more about the story.

Become a Premium Member ($3/month or $30/year) and get exclusive features!

Become Premium

Too expensive? Make a small donation by buying us coffee ($5) or help with server cost ($10)

Donate via Paypal

Or Donate anonymously using crypto!

Ethereum

0xfe58350B80634f60Fa6Dc149a72b4DFbc17D341E copy

Bitcoin

3ATGMxNzCUFzxpMCHL5sWSt4DVtS8UqXpi copy

Thank you for your support!

Follow Us on Twitter!

:(