Something extraordinary is happening in the Middle East weather wise.
This thread begins in Ethiopia because it is playing a part in this, and will also receive rain from albeit not on the scale of what is happening to the north, in places where they are not used to this much.
This thread begins in Ethiopia because it is playing a part in this, and will also receive rain from albeit not on the scale of what is happening to the north, in places where they are not used to this much.
The thread attached here is supplementary, posted earlier it contains videos mostly from @Arab_Storms who is based in the UAE whose account is documenting #ExtremeWeather events, with a focus on the #MiddleEast
It contains videos mostly from yesterday.
It contains videos mostly from yesterday.
https://twitter.com/althecat/status/1477598089435303939?s=20
@Arab_Storms This thread relates to today, or more specifically the last 24 hours which has seen even greater storm activity than yesterday. This thread posted last night contains similar data to what I will be posting now about the extent and location of rainfall.
https://twitter.com/althecat/status/1477373150346182656?s=20
Here's s a broad view of what is going on.
1. LHS: an atmospheric river is coming in from the Atlantic.
2. Top Right: remnants of a storm heading south
3. Bottom Right: The monsoon is sending water north east over Ethiopia.
1. LHS: an atmospheric river is coming in from the Atlantic.
2. Top Right: remnants of a storm heading south
3. Bottom Right: The monsoon is sending water north east over Ethiopia.
And this is the result of all this combining over the Middle East. And the contribution from the much closer West African Monsoon (transiting CAR & Sudan) is probably the dominant impact today.
The result is #DesertRain across the entire region. This weather event began Christmas Day, and is still building in its intensity. Egypt received rain yesterday.
Below: Today's rainfall from @meteoblue, starting 6pm yesterday.
Quoted Tweet: Yesterdays.
Below: Today's rainfall from @meteoblue, starting 6pm yesterday.
Quoted Tweet: Yesterdays.
https://twitter.com/althecat/status/1477389464808927240?s=20
Here''s an animation showing the storm over Egypt's arrival yesterday. Its impact on events is significant as it has come south and is bringing with it cold air which is contributing to the level of rainfall.
And here's a broader picture of what we saw happening yesterday. Similar to today but as you will soon see not quite as impactful.
This final animation shows yesterday's visible water transit over the Horn of Africa, which as you can see is less intense than today's. Water in the atmosphere is only visible when it condenses in to clouds, and that depends on density, temperature and altitude.
Ok so that's the explanation here is the major event today, which is still underway, albeit not mainly over Iran. This is the largest and most intense storm I have ever seen over the Middle East.
Although, admittedly I have only been watching for a year.
Although, admittedly I have only been watching for a year.
Based on the size of Iran at 1.6 million Km2 I'd say that at its peak - as it crosses the Gulf - the three storm complexes cover and area of a little smaller than the size of Ethiopia (1 million Km2).
It is made of large thunder storms, i,e, tornado forming supercells.
It is made of large thunder storms, i,e, tornado forming supercells.
Here we see the build up to the storm yesterday evening, based on the animation Kuwait and Iraw apears to have received the most rain.
Here we see a closeup of 24 hours over Kuwait, which unlike Iraq we have weather radar data for.
This view shows the six hour period from 4am to 19pm in close up. Its clear that Kuwait was the epicenter of the most intense part of this storm.
N.B. This does not appear to be simply another freak #ExtremeWeather Event.
Forecasts show the underlying causes for what is happening in the Middle East persisting for the entire forecast period to Jan 17th.
Forecasts show the underlying causes for what is happening in the Middle East persisting for the entire forecast period to Jan 17th.
https://twitter.com/althecat/status/1477381531106570241?s=20
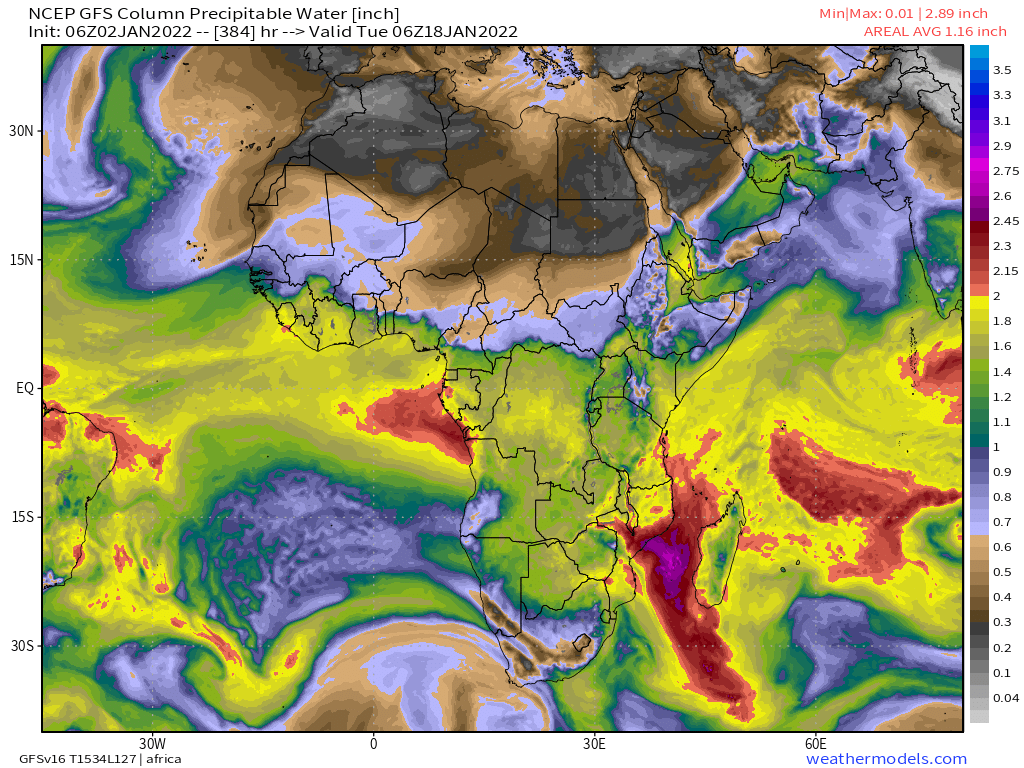
That's a 16-day rainfall forecast from yesterday - for all of Africa. And this is a 15 day integrated water vapour transport forecast which shows a similar event to this occurring again, a northerly storm colliding with tropical water flows from the west and south.
This is from the latest 16-day Precipitable water forecast for the ME . From 9th Jan we see the pattern that has occurred over the past three days, repeat - twice - two northerly storms over Egypt colliding with warm wet air masses over the Arabian Peninsula.
Starting around January 9th the first phase of this is forecast to have its primary impact in Egypt and the Levant, then Iraq and then move down over Saudi Arabia and the Gulf. The 2nd event contains a deeper low, i.e. a stronger storm.
This shows simulated rain for that first event.
But as previously noted the simulation models are poor at estimating the actual rain impacts in the ME, which was demonstrated spectacularly overnight in Kuwait. This does however show likely affected areas.
But as previously noted the simulation models are poor at estimating the actual rain impacts in the ME, which was demonstrated spectacularly overnight in Kuwait. This does however show likely affected areas.
And this shows the following six days through to January 18th. Again we have rain in the Levant, Northern Saudi Arabia, Jordan, Iran and the Gulf.
But based on what we have seen over the past seven days, I would expect the impacts to be considerably more widespread.
But based on what we have seen over the past seven days, I would expect the impacts to be considerably more widespread.
Finally the 24 million dollar question is will this pattern stop?
And the only way I can think of to look at current weather conditions and what are predicted by the deterministic models at the end of the forecast period. Here is 0/384 hour jetstream winds.
And the only way I can think of to look at current weather conditions and what are predicted by the deterministic models at the end of the forecast period. Here is 0/384 hour jetstream winds.


For this first comparison the January 18th forecast looks worse. These two PWAT pictures look about the same.

Ditto the IVWT (integrated water vapour transport picture.
But the third and fourth pictures here show one of the key elements persisting, namely the Senegal to Makkah water superhighway.
But the third and fourth pictures here show one of the key elements persisting, namely the Senegal to Makkah water superhighway.


And if that Jet Stream is persistent then I think the phenomena we are seeing here will persist also.
The other ingredient to the #ExtrremeWeather aspect of this is the presence of cold air low pressure systems interacting with the humid air over the ME. This animation shows the origins of the two systems in the current forecast period.
And it shows three, all of which appear to be small seeded lows, originating from a procession of large northern low pressure systems heading west to east across northern Europe. A pattern which may also be persistent.
We shall see in due time. And there will be real meteorologists who are qualified to have an informed view on this. But to me this looks like a new weather pattern that may persist through winter.
Over Spring and Summer 2021 we saw a similar, albeit less intense consistent pattern of precipitation over the Arabian Peninsula. It may well be that this is one of the first regional scale changes in climate systems due to climate change which will have a major long term impact.
Back in April, shortly after I first started looking at changing Saharan and then Ethiopian weather I posted a thread about "Sahara Pump Theory" which predicts exactly what we are seeing now.
https://twitter.com/althecat/status/1382719761210036225?s=20
The theory - which is based on archeology from 16k-6k years ago also fits current long term climate change modelling (see tweet).
https://twitter.com/althecat/status/1382737728022929411?s=20
And interestingly - as I have recently discovered - the consequences of the theory - i.e. a verdant arable Arabian Peninsula with meadows and streams is also mentioned in the Koran.
/ends
@Threadreaderapp unroll
@Threadreaderapp unroll
• • •
Missing some Tweet in this thread? You can try to
force a refresh