@DrEricDing I love it when so-called 'experts' comment on matters they know nothing about.
So here are some facts:
//thread
So here are some facts:
//thread
@DrEricDing #Omicron IS a mild virus. Data from South Africa (and now England) PROVES that and is confirmed by Chief Medical Officers. To suggest otherwise is medically illiterate and unscientific #conspiracytheory
https://twitter.com/statsjamie/status/1470061933109952516?s=20
@DrEricDing Staff shortages in the #NHS are arising due to excessive testing amongst asymptomatic staff & the policy of self-isolation in the event of a +ve test result, using a test that according to the CDC does not distinguish between CV & the flu.
cdc.gov/csels/dls/locs…
cdc.gov/csels/dls/locs…
@DrEricDing The UK has also seen public health policy greatly impact hospitals. Many care homes are unable to reopen due to staff shortages resulting from the @GOVUK’s mandatory vaccine policy, leading to the hospitalisation of many elderly people requiring care.
@DrEricDing @GOVUK This same policy will also deeply impact NHS staffing levels from April onwards when they come into effect, if not sooner.
https://twitter.com/SteveBakerHW/status/1470503469811486728?s=20

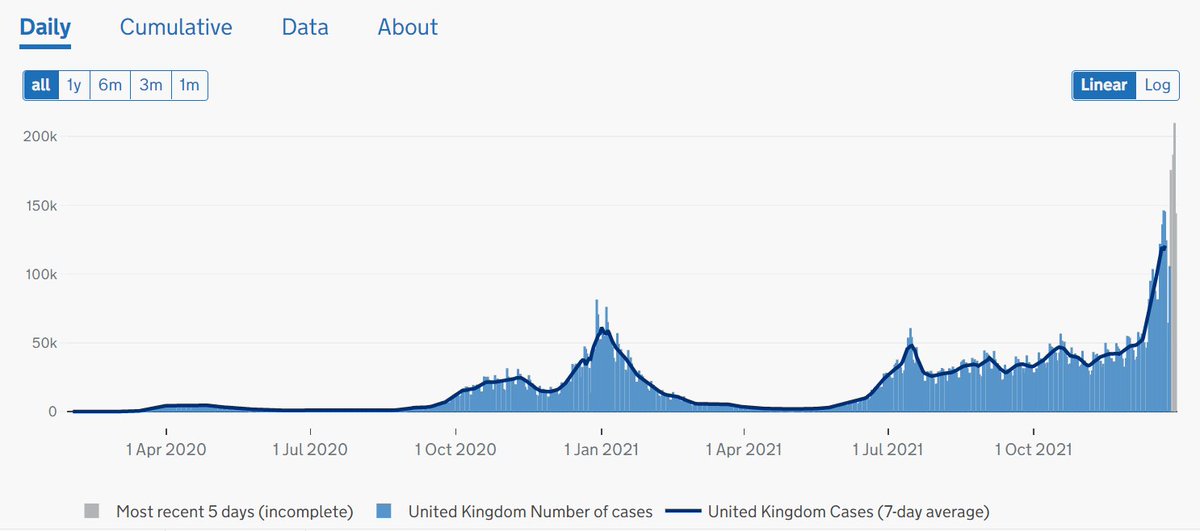
@DrEricDing @GOVUK On the impact of Omicron, in the UK, we have seen testing numbers far exceeding that of anywhere in the world, having reached 1.5-1.6m PER DAY. 

@DrEricDing @GOVUK This explains why ‘cases’ (+ve test results) in the UK are so high. However, it’s important to note that these figures do not reflect how many are asymptomatic or mild cases.
@DrEricDing @GOVUK One way to establish severity of cases is to look at hospitalisation numbers. Whilst there has been a slight increase towards the end of December, as we see every year, those numbers are nowhere near to the numbers we saw this time last year.
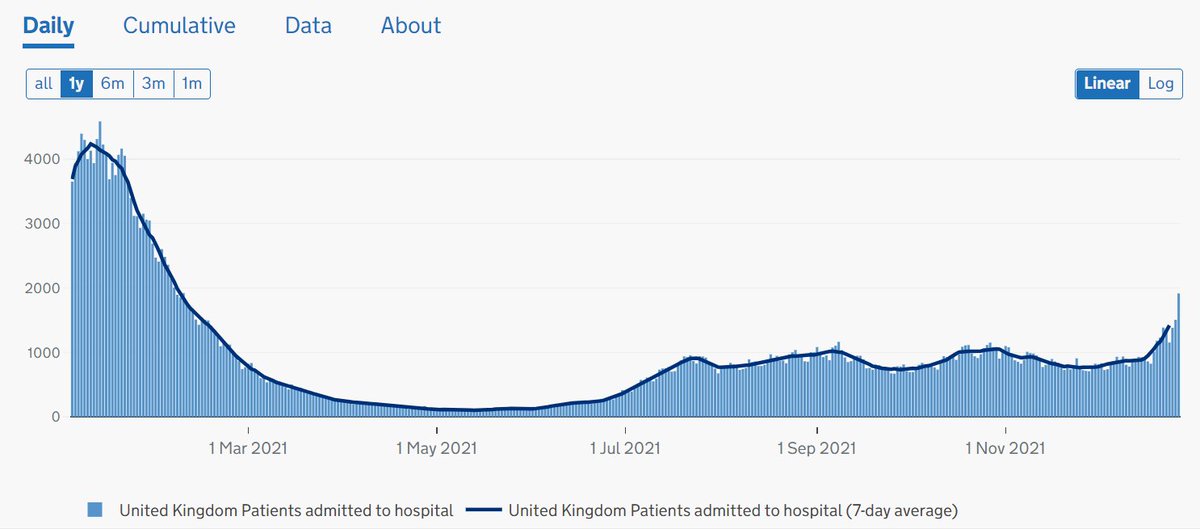
@DrEricDing @GOVUK UK hospitalisation data also shows that a third of Covid hospital cases are patients being treated for something other than Covid (‘incidental admissions’)
https://twitter.com/FraserNelson/status/1475598905882648588?s=20
@DrEricDing @GOVUK In fact, official data shows two-thirds of new CV hospital patients in ENG only tested +ve (several days) AFTER being admitted for a different illness; mounting evidence Omicron is milder and most ‘cases’ are nosocomial (spread in hospitals)
dailymail.co.uk/news/article-1…
dailymail.co.uk/news/article-1…
@DrEricDing @GOVUK To summarise, YES #Omicron is a mild variant that largely produces symptoms akin to the common cold/flu & there is a clear incidental disconnect to hospitalisations + deaths.
Thus, any threat to the #NHS is the result of political decision-making & NOT directly from of the virus
Thus, any threat to the #NHS is the result of political decision-making & NOT directly from of the virus
@DrEricDing Please unroll .@threadreaderapp
• • •
Missing some Tweet in this thread? You can try to
force a refresh