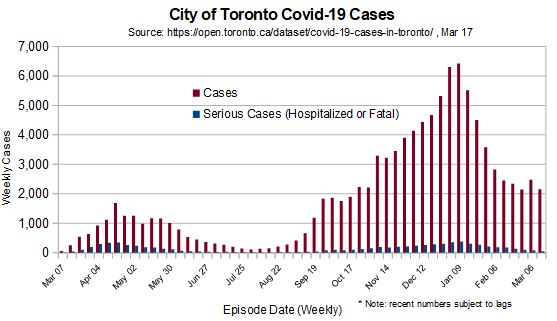
City of #Toronto Covid-19 update, Jan 5. Serious cases (hospitalizations and/or fatal) are well below one year ago. This weeks number will increase significantly though, due to lag in episode date. #COVID19Ontario#onpoli
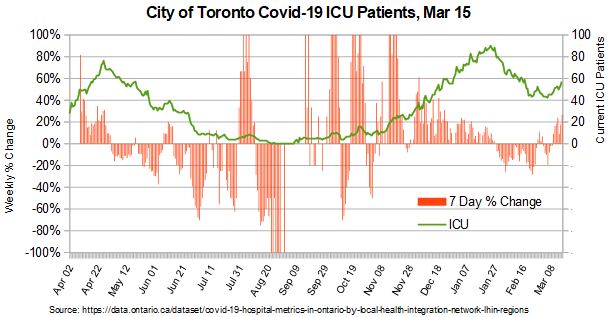
City of #Toronto Covid-19 update, Jan 5. ICU occupancy is well below one year ago. CRCI = covid related critical illness. #COVID19Ontario
City of #Toronto Covid-19 update, Jan 5. Current hospitalizations with Covid have eclipsed levels from this time last year. The number is questionable though with the City reporting 161 vs the Provinces 323!?! #COVID19Ontario
City of #Toronto Covid-19 update, Jan 5.
Since Dec 1, by episode date, only 33 have been admitted to ICU with Covid. 24 were age 60+ and 9 under 60. In line with provincial trends: #COVID19Ontario
• • •
Missing some Tweet in this thread? You can try to
force a refresh
City of #Toronto Healthcare System, 14 days ending Jan 1, 2022. Covid-19 serious outcomes by vac' status. 🧵
Hospitalizations: Fully vac'd accounted for 117 new hospitalizations, 77% of total. #Covid19Ontario#onpoli
2/ City of #Toronto Healthcare System, 14 days ending Jan 1, 2022.
ICU: Fully vac'd accounted for 11 new ICU admissions, 61% of total. #Covid19Ontario#onpoli
3/ City of #Toronto Healthcare System, 14 days ending Jan 1, 2022.
Deaths: Fully vac'd accounted for 11 fatalities, 73% of total. #Covid19Ontario#onpoli
Ontario data shows that vaccines are very effective at preventing C19 as well as serious outcomes if infected. However, most of the benefit comes from vax'ing older age groups. 1/5 #COVID19ON#Covid19Ontario
Hospitalizations are dramatically lower in C19 cases in vaccinated (breakthrough) vs. unvaccinated. (data expressed as cases per 100,000). But, in younger age groups the actual impact is less than for older. 2/5
Consolidating age groups shows clearly that vaccinations, have less impact on outcomes in younger ages. 3/5
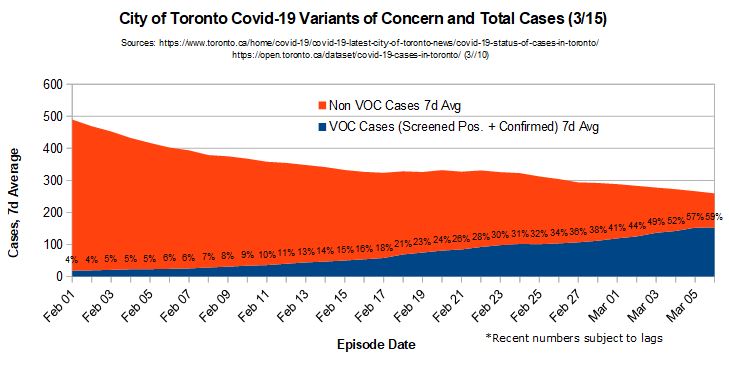
1/ City of #Toronto Covid-19 variants of concern. 7 day average of cases screened for spike mutation plus confirmed variants of concern as a portion of overall cases, by episode date. #COVID19Ontario
2/ The chart above is the best representation of the status of VOC that I can produce with public data. It comes from Toronto's Covid Status of Cases page. They have a chart showing screened and confirmed voc cases by episode date. I combine this with cases by episode date...
3/ from their public covid case dataset. It is important to use episode date because the cases announced as screened + for spike mutation, and confirmed as voc on a given day, are not necessarily (in fact rarely) cases from the same day. From watching these numbers closely...