#Bitcoin

Hey, my favorite $BTC "Analyst" just educated me that higher 10Y yields will drive #BTC up.

Now Yield are even breaking out but $BTC is down?

I told you before, these guys are absolutely clueless about #Macro.

🧵Thread 👇 Image
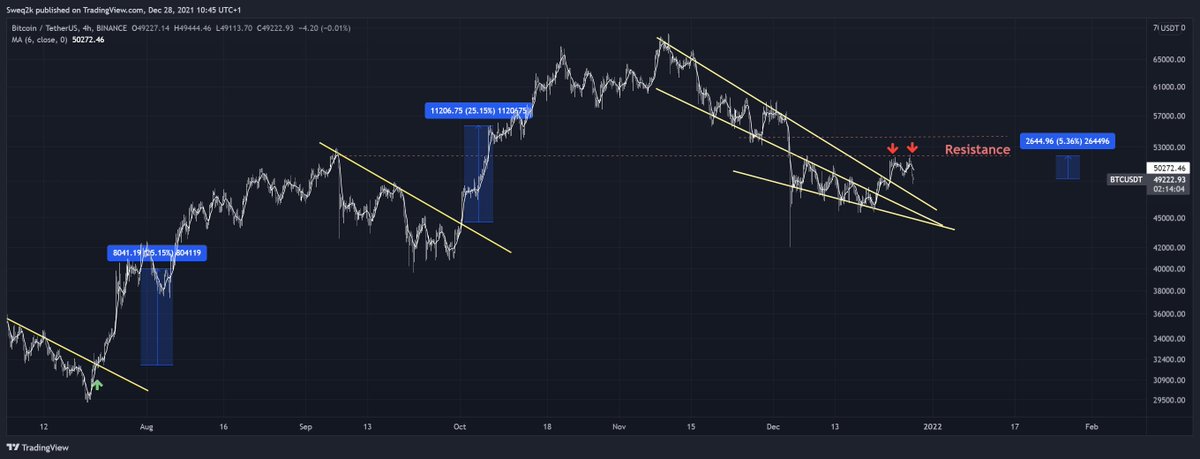
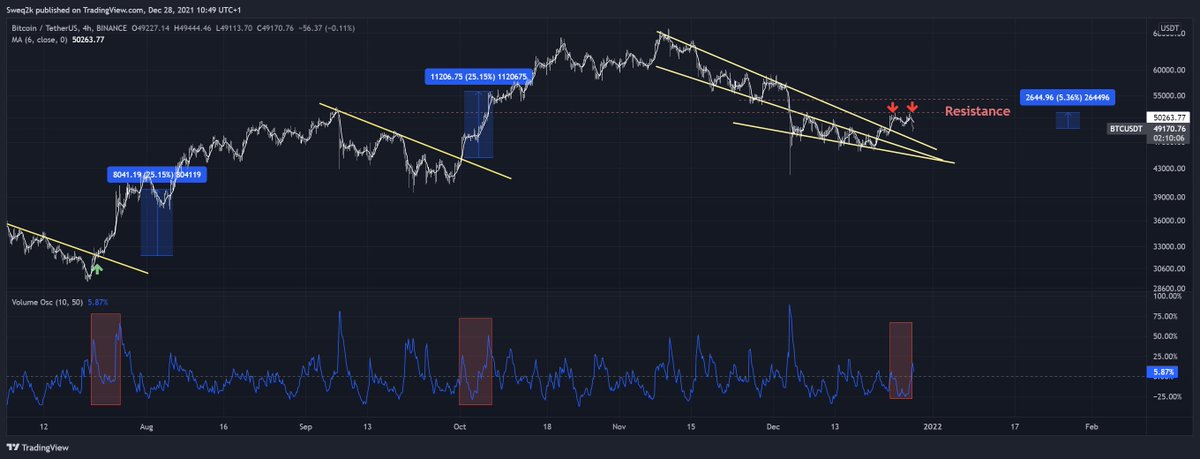
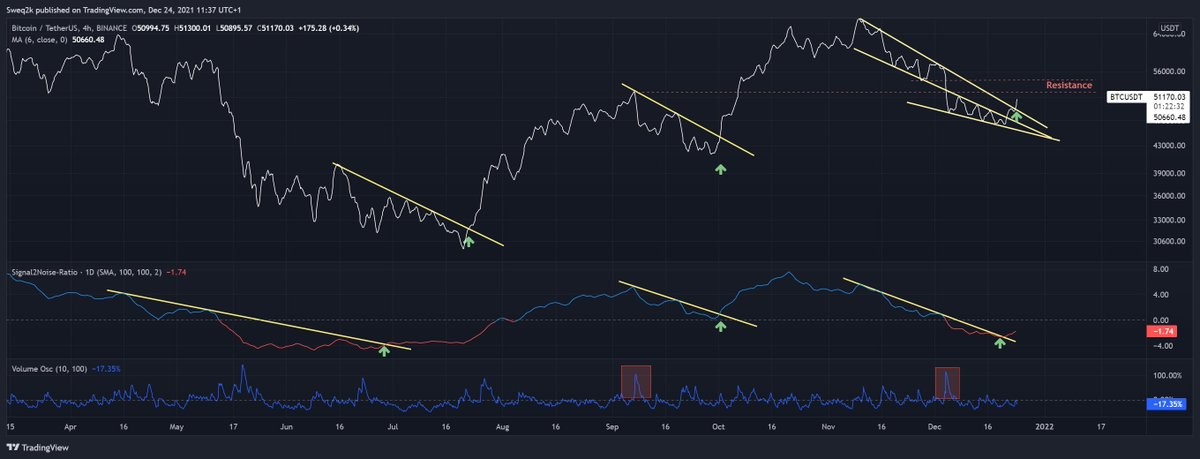
First, technically speaking, as shown in the previous tweet, correlations change over time and are not consistent. Just because some guys hold two chart patterns next to each other has nothing to do with long-term correlations. Correlations can change rapidly.
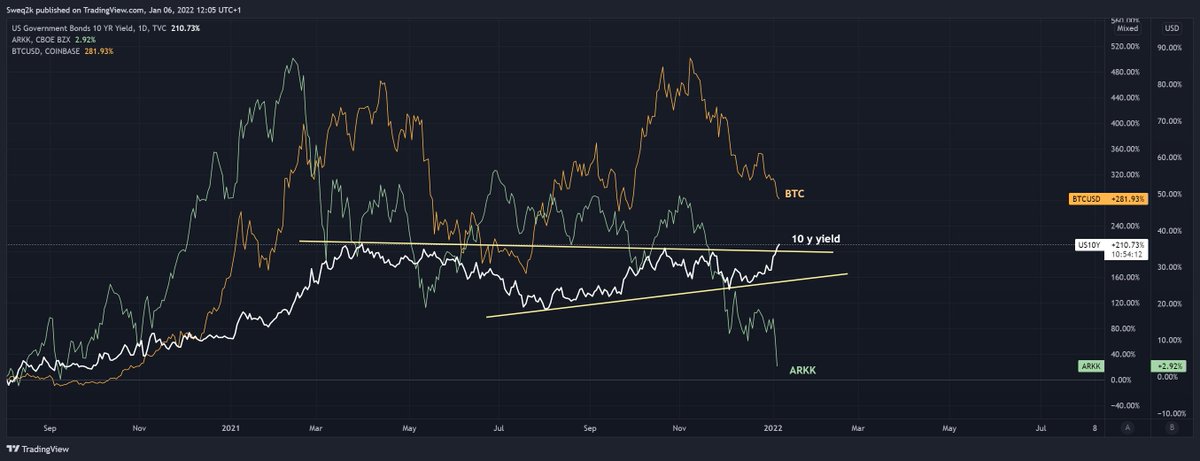
Second, correlation is not causation. Yields do not drive BTC, macro factors drive yields AND BTC. Yield and BTC moves are a RESULT.
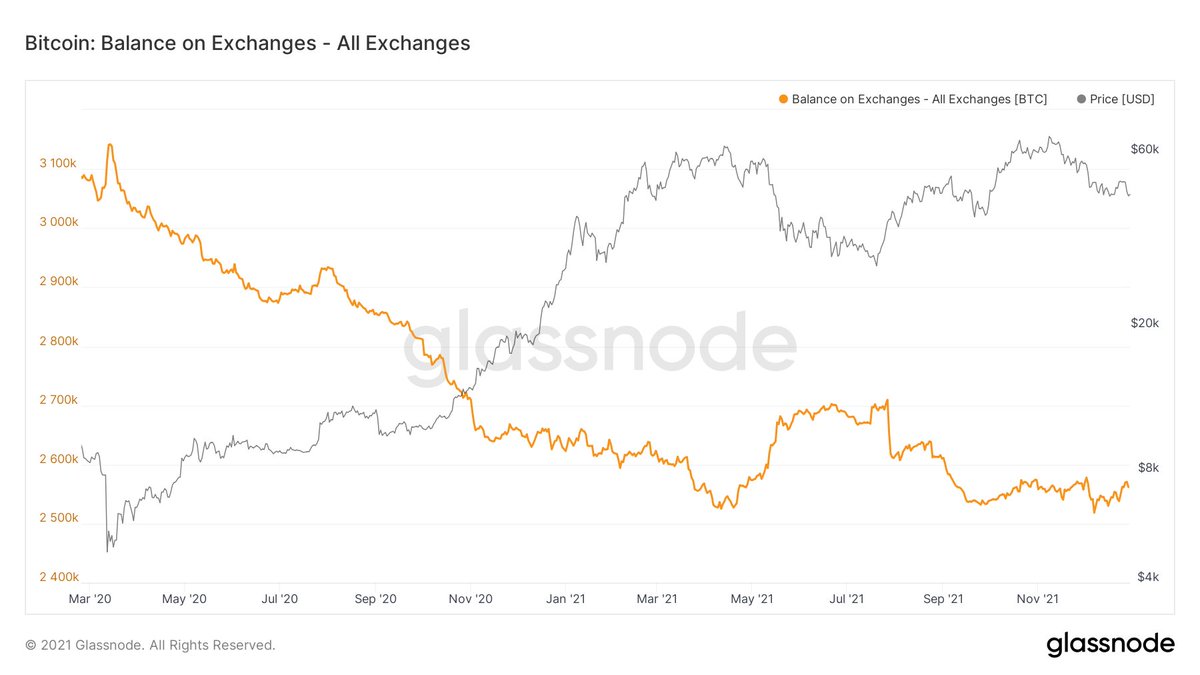
After March 2020 monetary and fiscal policy stimulated everything. This means: risk on. Sell LT bonds (yields up), buy risky tech and crypto etc
Now there is monetary tightening (ST yields up, liq. down), this is shifting risk appetite, high growth tech (ARKK) and crypto sell off. But there is still solid growth and inflation in the economy, so all together even LT yields keep still going up.
In traditional markets this is often a period where value stocks outperform growth, esp. after everyone was overweight growth in such a extreme manner. This does not mean the end of the stock market but a shift in its sub-segments. The whole 2002 to 2007 cycle was value driven!
In order to be successful you need to read books and follow the right people and learn about causation and reaction functions. If you only put similar chart patterns next to each other without understanding them you won't improve your skills.
If growth and esp. inflation would cool off and LT yields would come down as a result and the central bank gets more cautious on tightening, tech und #BTC could even run again. So just the opposite correlation. This is BTW my macro assumption, which I have described.
This would cause a similar reaction like just now - just in the opposite direction. I just think the system is very fragile under the hood and that growth will rather surprise to the downside and not stay strong and be able to tolerate higher yields.
We will see. I hope you excuse my sarcastic tone above. I'm a very polite guy and always respect different opinions, but what I do not like is spreading of nonsense and misinformation.

• • •

Missing some Tweet in this thread? You can try to force a refresh
 

Keep Current with Signal2Noise

Signal2Noise Profile picture

Stay in touch and get notified when new unrolls are available from this author!

Read all threads

This Thread may be Removed Anytime!

PDF

Twitter may remove this content at anytime! Save it as PDF for later use!

Try unrolling a thread yourself!

how to unroll video
  1. Follow @ThreadReaderApp to mention us!

  2. From a Twitter thread mention us with a keyword "unroll"
@threadreaderapp unroll

Practice here first or read more on our help page!

More from @signal2noisebtc

8 Jan
#Bitcoin $BTC

Bull Market or Bear Market ?

Or: maybe that's the wrong question.

Thread 🧵 Image
The study of BTCs price history teaches us the 4 year boom and bust cycle. However, one needs to ask the question, whether this pattern will continue or whether it was maybe driven by very specific factors and whether these factors might change.
The key underlying driver is clearly exponential growth, a rapid adoption of a new technology. Clearly visible through network growth and price development on the log chart. And this is no new concept but can be found in previous developments such as the internet.
Read 25 tweets
1 Jan
#Bitcoin $BTC - Network growth
1/17
Based on @RaoulGMI's recent tweet on BTC's network growth I did some more analyses

The conclusion: recent price development is well explained by network growth and the fact that we did not have a blow-off top is also probably not a surprise
2/17
The above chart shows the percentage growth of non-zero BTC addresses over a 90 day window.

The growth slowed significantly after early 2018. Percentage wise this is not a surprise as the network grows bigger but the below chart shows the total change instead of the %.
3/17
The growth is still remarkable but when you compare the peak of 2018 vs 2013/14 and then look at 2021, it is even in absolute terms below the 2017 blow-off top.
So the demand for a blow off top was pot. not there this time (Retail rather chasing ALTs ?)
Read 18 tweets
30 Dec 21
#Bitcoin $BTC Update - What's next?

1/8 🧵

Short TA update first
✅Reclaim of support line.

Believe it or not, this is a better spot than 49k on Dec 22, as we are now still above the major downtrend (d1)

Bull div building. We could at least see a small bounce here soon.
2/8

However, the real trend is difficult to predict, I think we saw a lot of reshuffling from Asian investors / tax related selling.

Huobi BTC balance down 200k coins since May, Dec alone 30k, while Binance up ca. 30k and total market balance flattish.
3/8
I'm sure there was not only reshuffling of coins but also selling from China (others have shown the selling during the Asian sessions over past weeks)
Then you have a huge option expiry tomorrow and it's still holiday season.
Read 9 tweets
28 Dec 21
#Bitcoin $BTC - Short-term view
1/4
As mentioned in the previous longer thread, I want to see a decisive break of the 52-54k level.

Yesterday, selling came back exactly at 52k. Pretty weak PA, also considering how strong equities have performed these days. Image
2/4
The break of the downtrend was also not comparable to the last two ones, where we went for an almost 25% uninterrupted move from the breaks of the downtrend + a spike in volume on the moves up (See volume oscillator) Image
3/4
49k needs to hold as higher low in line with previous local highs before the breakout. If 49k goes, I could easily see 47k (SR flip of downtrend) or 45k (prev. lows) incoming.
Read 4 tweets
24 Dec 21
#Bitcoin $BTC update - HTF picture
1/25
The recent move above 51k was encouraging as we have left the major downtrend.

What is next?

A) TA Update
B) S2N Update
C) On-chain metrics
D) Derivatives/Leverage
F) Macro

🧵 Image
2/25
1) TA Update

The chart above uses a little "trick". Instead of using the a often quite noisy 4h-1d candlestick chart I sometimes use a rolling 24h chart based on a 4h chart that nicely reduces the noise and provides a clear picture of market structure.
3/25

There is a nice break of the recent downtrend that was supported by a break in momentum trend as shown by S2N ratio in the second chart. The change in momentum often leads the price change as also seen in July. Pinned tweet shows it called the bottom correctly in July.
Read 26 tweets
23 May 21
#Bitcoin update
1/12
The key question is whether we are still in a bull market.

I took a different look at this question in terms of a new way of measuring cycle lengths through my S2N Ratio model.

Thread 👇
2/12
What I have done in the chart is to graph the S2N ratio on the chart to indicate the key levels. The red line, is where the S2N reaches 35, i.e. price is 35 vol units away from 200 week MA.
3/12
Touching the red lines is where market peaks happened in the past. This was clearly not the case this time and I mentioned it before and this is also not the point I want to repeat again today.
Read 12 tweets

Did Thread Reader help you today?

Support us! We are indie developers!


This site is made by just two indie developers on a laptop doing marketing, support and development! Read more about the story.

Become a Premium Member ($3/month or $30/year) and get exclusive features!

Become Premium

Too expensive? Make a small donation by buying us coffee ($5) or help with server cost ($10)

Donate via Paypal

Or Donate anonymously using crypto!

Ethereum

0xfe58350B80634f60Fa6Dc149a72b4DFbc17D341E copy

Bitcoin

3ATGMxNzCUFzxpMCHL5sWSt4DVtS8UqXpi copy

Thank you for your support!

Follow Us on Twitter!

:(