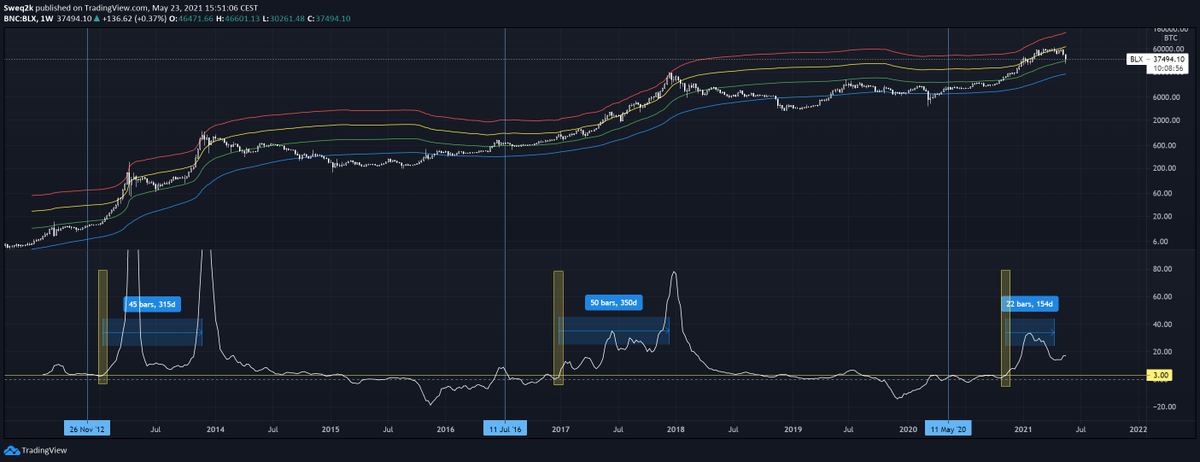
The study of BTCs price history teaches us the 4 year boom and bust cycle. However, one needs to ask the question, whether this pattern will continue or whether it was maybe driven by very specific factors and whether these factors might change.
The key underlying driver is clearly exponential growth, a rapid adoption of a new technology. Clearly visible through network growth and price development on the log chart. And this is no new concept but can be found in previous developments such as the internet.
Even certain stocks follow this principle of exponential network growth such as FB or Amazon:
https://twitter.com/RaoulGMI/status/1479640564765184000?s=20
Next step is to look at what has caused these "4 year boom/bust" cycles within this overall exponential growth. Foremost this is the halving induced supply reduction that is taking place. 

What is obvious from the above supply chart (yellow line), is that this effect of supply reductions is wearing off rapidly.
The total supply at the end of each cycle was roughly:
10.5m
15.75m
18.4m
18.9 (as of today)
The total supply at the end of each cycle was roughly:
10.5m
15.75m
18.4m
18.9 (as of today)
So this impact is wearing off substantially.
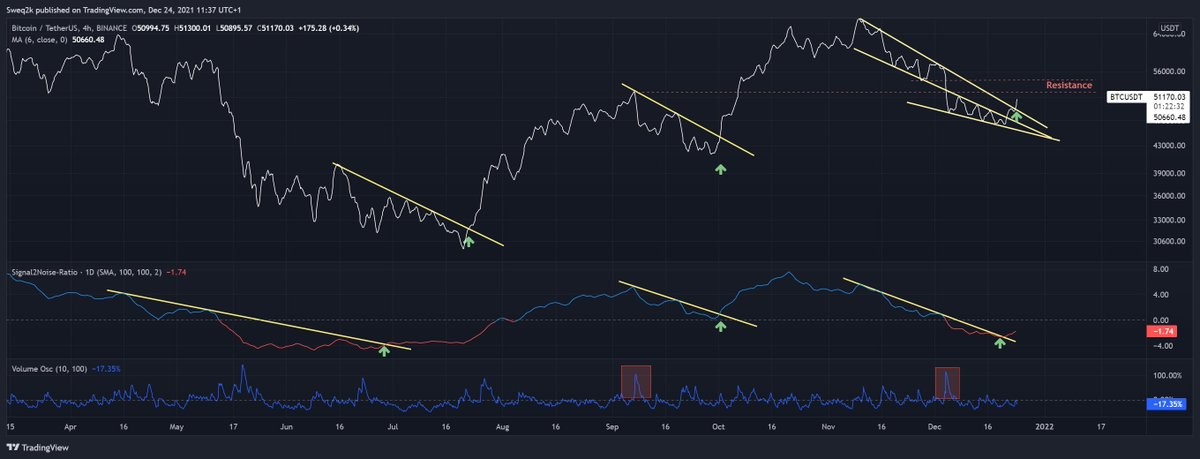
One other "feature" has been blow-off tops in the past which I am often referring to with my S2N ratio.
One other "feature" has been blow-off tops in the past which I am often referring to with my S2N ratio.

The previous two cycles have both seen strong (esp. retail driven) blow-off tops, which are short unstable periods of only few weeks. This time around we had a "rounded" top, we "only" went to ~20x of vol above the 100 week SMA instead of 30-35x as in previous cycles.
So lets put this all together. A blow off-top combined with increasing supply measured in USD creates a huge USD amount that needs to be absorbed, so the higher the supply inflation and the higher the blow-off top the more unstable will the supply/demand balance get (Prev. peaks)
What follows in such a scenario is a long bear market as supply is fixed and price needs to clear everything. Similarly there is a supply shock after the halving that meets a price that is low enough to clear for the demand from the previous higher supply but needs to rise now.
You see where this is getting. The fact that supply is fixed as well as the supply changes amplify the moves, esp. when you add psychology on top with hype and bust cycles on the demand side to it. This is all a self-reinforcing feedback loop.
As the supply inflation reduces rapidly, its impact should become smaller. In addition, the market gets larger and is more liquid and can better cope with changing demand and supply dynamics.
So what we could well see is actually a deviation from these extreme previous patterns. A few signs are already there:
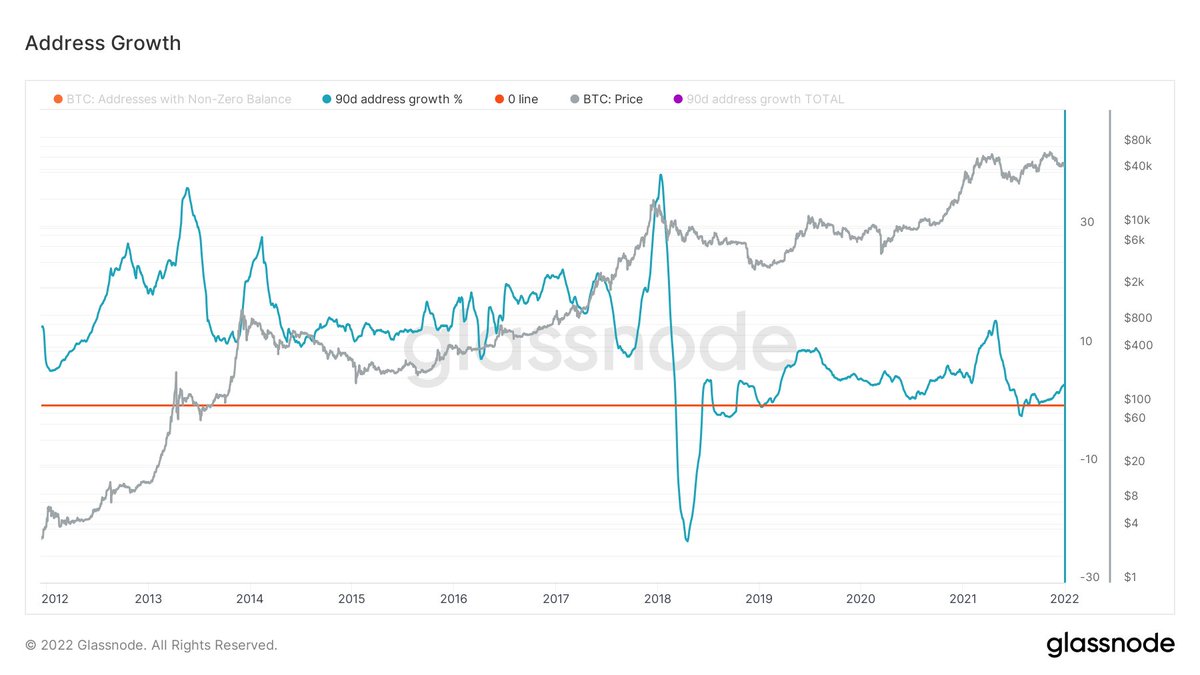
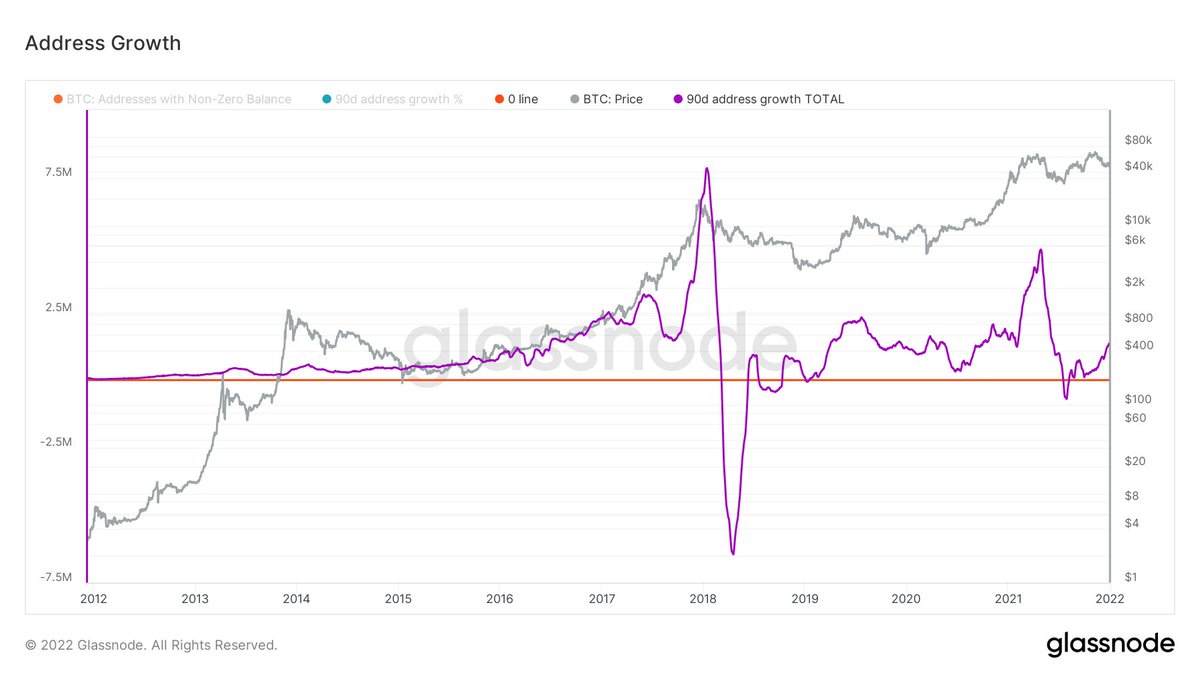
We did not have a blow-off top so far, despite strong retail participation after a prominent trigger event. I have posted this chart on network (BTC non-zero addresses) growth recently.

What you see is a pickup in address growth after @elonmusk had announced that Tesla has put $BTC on its balance sheet. This was definitely the peak retail mania leading to the local top, which is visible in the chart IMO.
Interestingly, this mania phase did not produce a blow-off top. Therefore many argue that we have not seen the end o this cycle.
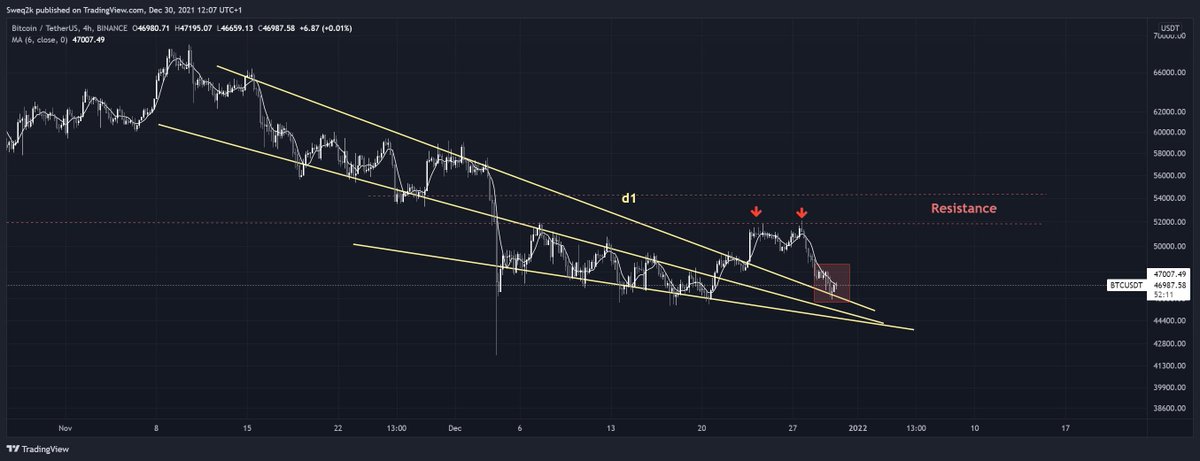
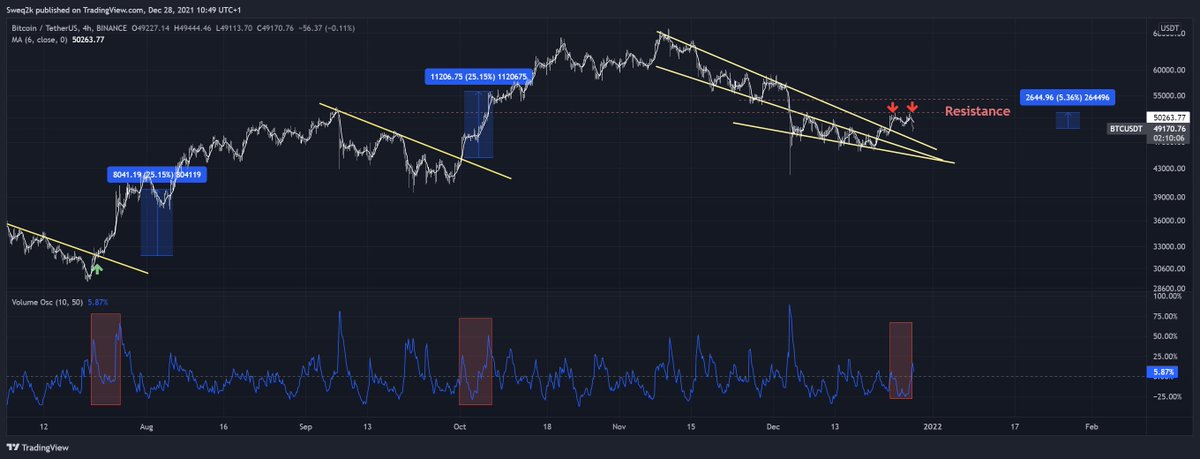
Now on bear markets: You could now also argue with the current price action that we have already potentially entered a bear market.
Now on bear markets: You could now also argue with the current price action that we have already potentially entered a bear market.
Similarly like the argument for a blow-off top to mark the bull market extrem, the bear market extreme is often cited with BTC going down around ~90%. from the previous top.
But these drawdowns in the past were from a unstable blow-off top.
But we did not have one this time. If I use some rough approximations were S2N would have reached 35 in early 2021 to reflect a blow-off top as in previous cycles, I guess we would have peaked maybe at ~150k.
But we did not have one this time. If I use some rough approximations were S2N would have reached 35 in early 2021 to reflect a blow-off top as in previous cycles, I guess we would have peaked maybe at ~150k.
To compare the downside in a bear market with previous cycles one has to consider from where you are measuring these 90% declines.
If you consider we would have seen a blow-off top, the July low at around 29k would have been already -80%. So as wrong as it might be to assume a blow-off top, it might be equally wrong to extrapolate a 90% bear market if such an unstable blow off top did not occur.
What is also new in this cycle is that we have made higher lows after the July bottom. This is not the typical structure of previous bear markets.

Summary. First, I think that the extreme boom/bust cycles might become shorter with lower extremes (upside/downside) through reduction of supply changes and its impacts combined with a more liquid and mature market and less retail impact.
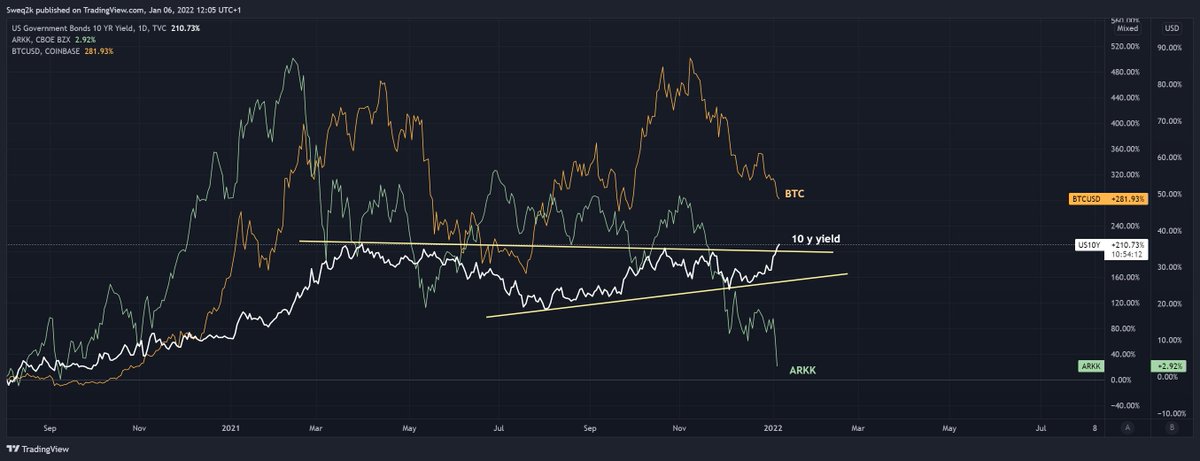
Second, increased institutional participation might also introduce a higher correl. with factors that drive their portfolio and risk management (Fed, fiscal, USD etc.). Third, general adoption of crypto has crossed a critical point IMO making a multi year bear market less likely
This is not a consideration on whether to buy or sell BTC at this price. But what you can derive from these thoughts is that the expectation of a blow-off top might be as wrong as to think that we will lose 90% based on a non-blow-off top peak if we are in a bear market now.
I increasingly think there is a likelihood of a gradual decoupling from these extreme patterns we have seen in the past.
• • •
Missing some Tweet in this thread? You can try to
force a refresh