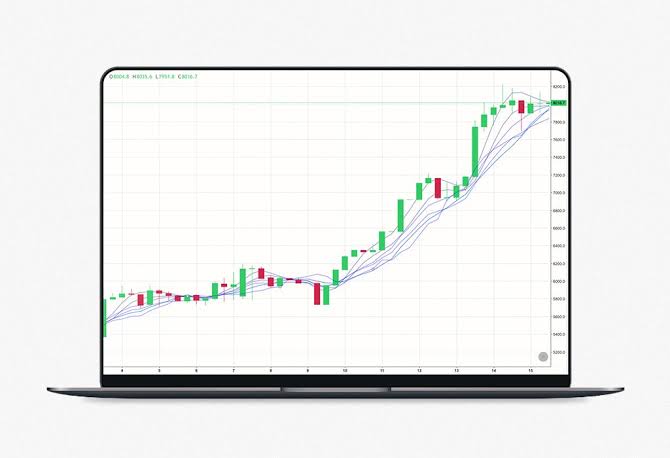
1. Simple Moving Average(SMA): #SMA is calculated by averaging the most recent price points.
Different types of prices like High, Low, Open, or Close are used to calculate SMA (2/21)
Different types of prices like High, Low, Open, or Close are used to calculate SMA (2/21)

2. Exponential Moving Average(EMA): EMA gives weightage to the most recent price points and makes it more responsive to recency.
The formula for calculating #EMA is as follows👇 (3/21)
The formula for calculating #EMA is as follows👇 (3/21)

Current EMA= [Closing Price - EMA(Previous time)] X Multiplier + EMA(Previous Time Period) (4/21)
3. Weighted Moving Average(WMA): Another reliable #indicator used for analyzing trade direction or buy/sell signals!
Here, weightage is given to the recent data points and less weightage to past data points (5/21)
Here, weightage is given to the recent data points and less weightage to past data points (5/21)
It is calculated by multiplying each point in the data set by a predefined weighing factor👇 (6/21)
4. Double Exponential Moving Average(DEMA): This indicator has been formulated to reduce lag results and is more responsive, helping short-term traders in spotting #trend reversals (7/21) 

DEMA allocates more weightage to the most recent data points, thus being more reactive to short-term changes👇(8/21)
5. Triple Exponential Moving Average (TEMA): DEMA was developed by Patrick Mullay, after finding out the lag in the calculation of DEMA IN 1994👇(9/21) 

The only difference between DEMA and TEMA is that TEMA's formula uses a triple-smoothed EMA, which is considered to be an upgraded, reducing the lag even DEMA could have had👇 (10/21)
6. Linear Regression/Least Square Moving Averages(LSMA): Calculates the least-squares regression lines of the preceding periods, helping with forwarding #price projections from the current period👇(11/21)
#Traders use this indicator to find out what can happen if the regression line is continued! (12/21)
The indicator is calculated based on the sum of least squares for finding a straight line that best fits the data for a specific time👇
To Read The Blog Click Here: sedg.in/4fz75ldj (13/21)
To Read The Blog Click Here: sedg.in/4fz75ldj (13/21)
To upgrade your trading skills, our exclusive event is coming up!
Presenting, Super Six: A Two-Day Trading Marathon by 6 eminent traders with 6 unique styles: sedg.in/udtwsy48 (14/21)
Presenting, Super Six: A Two-Day Trading Marathon by 6 eminent traders with 6 unique styles: sedg.in/udtwsy48 (14/21)
1. Using RS More Effectively by Premal Parekh (@premalparekh): A unique Trading model by the Guru of Relative Strength! sedg.in/ucpn7iw3
2. Open & High Strategy in Index Options & Futures by Sivakumar Jayachandran (@Justsiva123): A deep dive into Options & Futures with a simple but highly rewarding strategy (16/21) sedg.in/ik7xn6u1
3. Intraday Trading Using Market Profile by Jay Chandran (@niftywizard): Learn to take trades based on the Market Profile to generate consistent returns! : sedg.in/qnescwgu (17/21)
4. CPR Saves Trades- A Multi-Timeframe Approach by (@cprbykgs) Gomathi Shankar, who will reveal this strategy for the first time in a LIVE Market sedg.in/b8gi2rcj (18/21)
5. Weekly Income Strategy by Jegan (@itjegan): Learn the Advanced version of the famous Butterfly Strategy for Options Selling to generate significant returns on a day-to-day basis⚡ sedg.in/qlpx8672 (19/21)
6. Introduction to Algo Candles and Patterns by Vijay Thakare (@VijaySThakare): Automate your trades with the help of simple price action techniques and Algo!💵 sedg.in/3qbkshxj (20/21)
Book your seat for 2 days and get a Rs.2800 OFF! (21/21)
• • •
Missing some Tweet in this thread? You can try to
force a refresh


