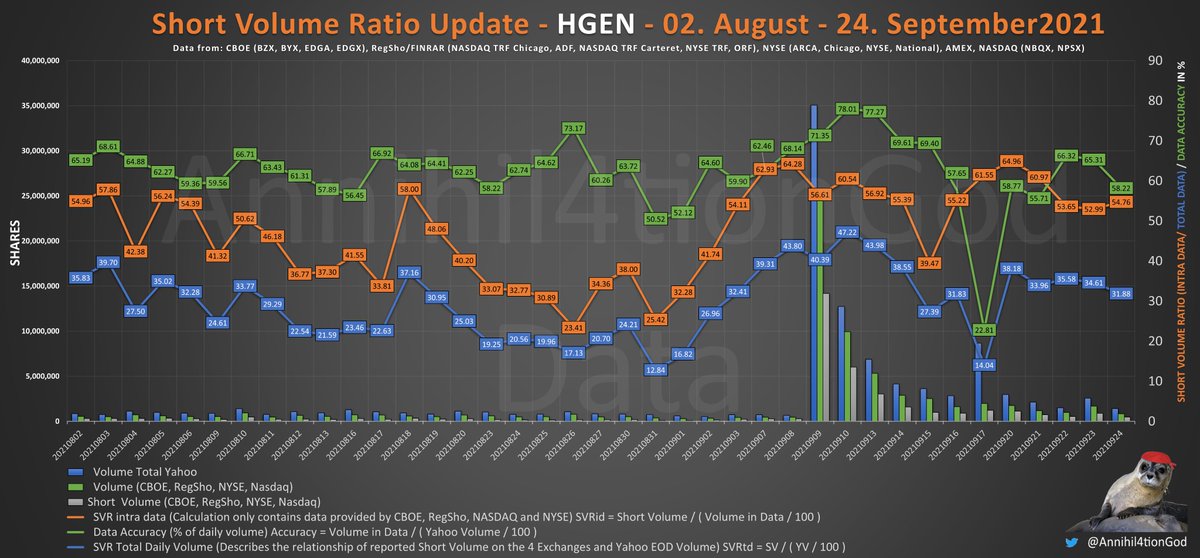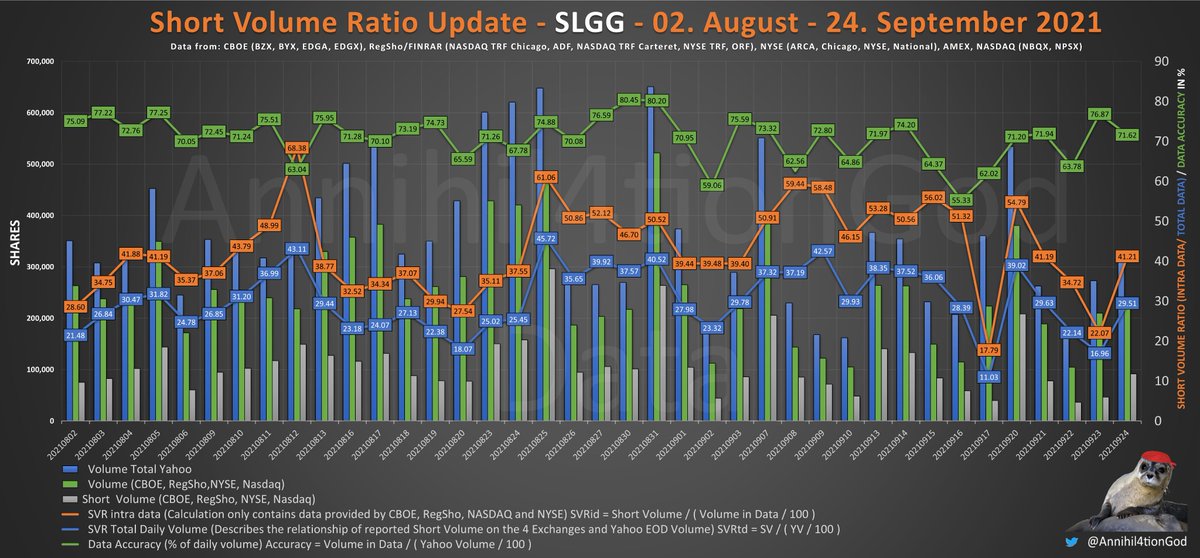
28.01.2022 - One year has passed since the financial industry decided to betray retail investors.
This is the best day to release my updated ShortData & FTD sets for 2009 to 2021! 😺
For everyone - for free - for every stock - because fk HF!👇🧵
mega.nz/folder/ck11VYC…
This is the best day to release my updated ShortData & FTD sets for 2009 to 2021! 😺
For everyone - for free - for every stock - because fk HF!👇🧵
mega.nz/folder/ck11VYC…
I want to provide this data to every retail investor because we don't have easy access to this kind of data. It took me more than half a year to find these files and I hope that retails can use it to do better DDs. No matter what stock you are interested in! This is for everyone!
Below you can find the following informations:
1. How the files look like
2. What is inside
3. How to extract the data for the ticker you like
4. Virus Scan
5. Sources
A tutorial on how to visualise this data will follow up together with a master sheet when I got some time.
1. How the files look like
2. What is inside
3. How to extract the data for the ticker you like
4. Virus Scan
5. Sources
A tutorial on how to visualise this data will follow up together with a master sheet when I got some time.
The folder contains .zip files for every year. To exclude that the files I share contain malware I did a virus total scan - the results and links can be found at the end of the tweet. 

This dataset contains:
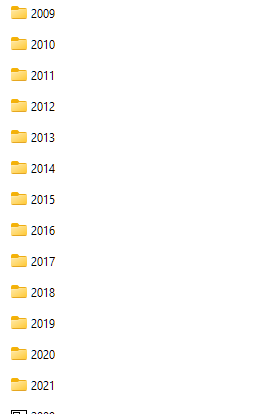
- All Short Data I was able to get since I started to collect boring .txt files for the timeframe 2009 to 2021 separated by years. (Picture 1)
- The FTD folder (0) and Short Data Information from different Exchanges (1-4)

- All Short Data I was able to get since I started to collect boring .txt files for the timeframe 2009 to 2021 separated by years. (Picture 1)
- The FTD folder (0) and Short Data Information from different Exchanges (1-4)

If you enter the 1 AMEX 2021 folder, you will find the following files.
All short data files provide informations regarding Short Volume and Total Volume for !every! stock traded on this exchange on this specific day.
Some exchanges also report short exempt volume.

All short data files provide informations regarding Short Volume and Total Volume for !every! stock traded on this exchange on this specific day.
Some exchanges also report short exempt volume.


Short Exempt Volume (SEV) is already included in Short Volume (SV), so no need to add up these numbers!
!Causion!
The Order of SV and SEV varies. Some Exchanges first report SEV, SV, TV (like above) and others change it to: SV - SEV - TV or SV - TV without SEV!
!Causion!
The Order of SV and SEV varies. Some Exchanges first report SEV, SV, TV (like above) and others change it to: SV - SEV - TV or SV - TV without SEV!
So how do you work with this data?
How can you find the data for $GME?
1. Get Notepad++ (free)
2. Press Ctrl + F and Choose "Search in Files", Enter "GME" and search (Pic 1)
3. As you can see, the result is not accurate, for this reason we change our search to |GME| -voila!

How can you find the data for $GME?
1. Get Notepad++ (free)
2. Press Ctrl + F and Choose "Search in Files", Enter "GME" and search (Pic 1)
3. As you can see, the result is not accurate, for this reason we change our search to |GME| -voila!


I will update this data set when possible - more information can be found on #Reddit. This place is meant to collect and share informations and DDs. This sub is "reading only " to keep it focused on sharing them, pls pm a Mod if you want to share yours!
reddit.com/r/FWFBThinkTan…
reddit.com/r/FWFBThinkTan…
Virus Total Scan for the shared Folder:
virustotal.com/gui/url/309199…
virustotal.com/gui/url/309199…
You can download the Short Data on your own here:
finra.org/finra-data/bro…
cboe.com/us/equities/ma…
ftp.nyse.com/ShortData/
ftp://ftp.nasdaqtrader.com/files/shortsaledata/daily/ (Use IE to access this page)
The FTD can be downloaded here:
sec.gov/data/foiadocsf…
finra.org/finra-data/bro…
cboe.com/us/equities/ma…
ftp.nyse.com/ShortData/
ftp://ftp.nasdaqtrader.com/files/shortsaledata/daily/ (Use IE to access this page)
The FTD can be downloaded here:
sec.gov/data/foiadocsf…
• • •
Missing some Tweet in this thread? You can try to
force a refresh


