2/5 Texas C19 Update - Cliff Diving
* Declines only steeping statewide
* Covid Hospital admissions plunge
* Record rates of declines everywhere
* Should be a nice spring!
THREAD
1/n
* Declines only steeping statewide
* Covid Hospital admissions plunge
* Record rates of declines everywhere
* Should be a nice spring!
THREAD
1/n
https://twitter.com/therealarod1984/status/1489598418410479617
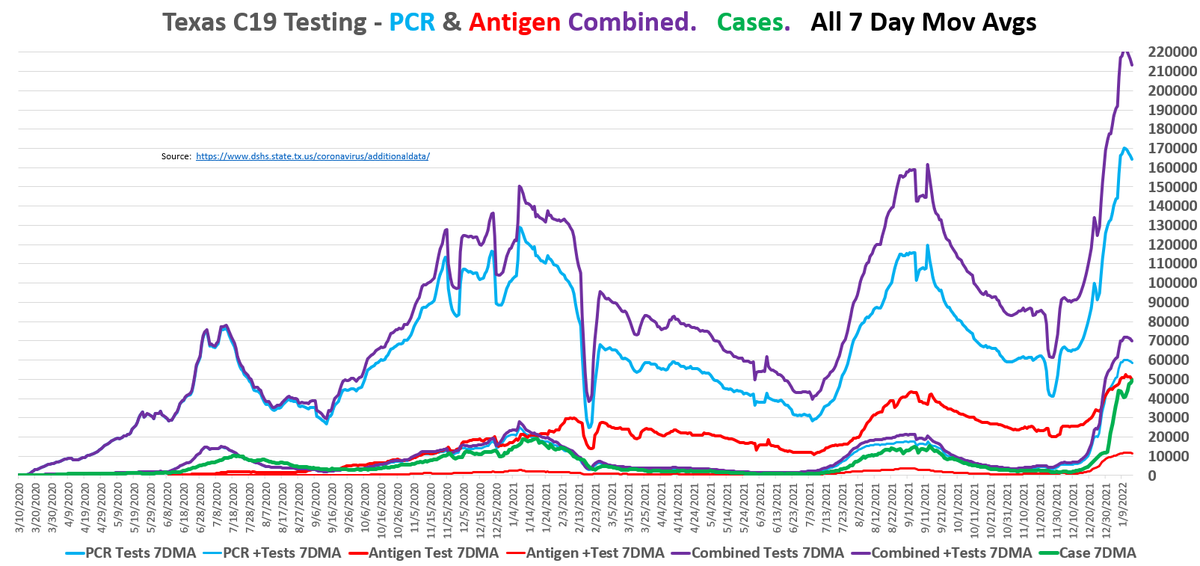
2/5 - Test reporting is by date of specimen collection, you have to wait ~10 days for a date to be ~90-95% in.
As of 1/26:
* We see the start of the plunge across testing, positivity rate & positive tests
* This manifests in today's case & hospitalization numbers
2/n
.


As of 1/26:
* We see the start of the plunge across testing, positivity rate & positive tests
* This manifests in today's case & hospitalization numbers
2/n
.


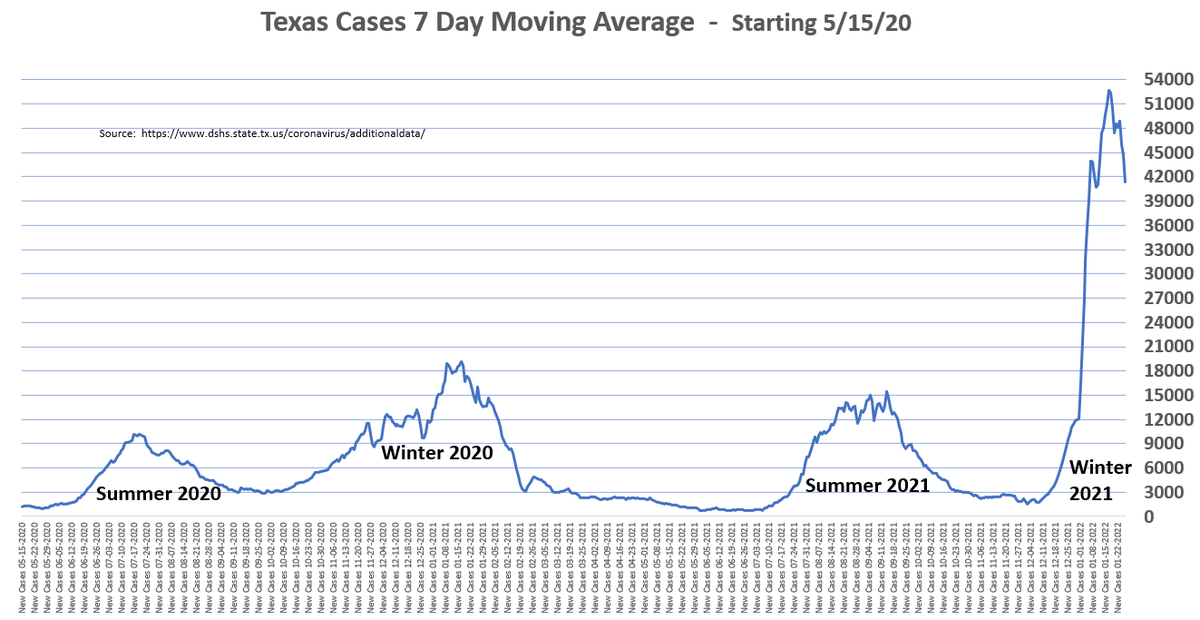
2/5 - Cases are simply reported as they are received by the counties.
* Cases 7DMA @ 21K after a huge drop week over week.
Only 12K cases reported today.
* 7DMA rate of week over week decline sets new record of 38%. Now mid 30%s for the past 7 days
* #plummeting
3/n
.


* Cases 7DMA @ 21K after a huge drop week over week.
Only 12K cases reported today.
* 7DMA rate of week over week decline sets new record of 38%. Now mid 30%s for the past 7 days
* #plummeting
3/n
.


2/5 - Hospitalizations
* Covid Admissions in free fall, 7DMA down 20% week over week (WoW) & still accelerating. Huge drop today.
* Covid General Census 7DMA following suit, down 10.5% WoW. Bottom about to fall out.
* Covid % of total beds down to 16.86%
4/n
.


* Covid Admissions in free fall, 7DMA down 20% week over week (WoW) & still accelerating. Huge drop today.
* Covid General Census 7DMA following suit, down 10.5% WoW. Bottom about to fall out.
* Covid % of total beds down to 16.86%
4/n
.


2/5 Severe Hospitalizations
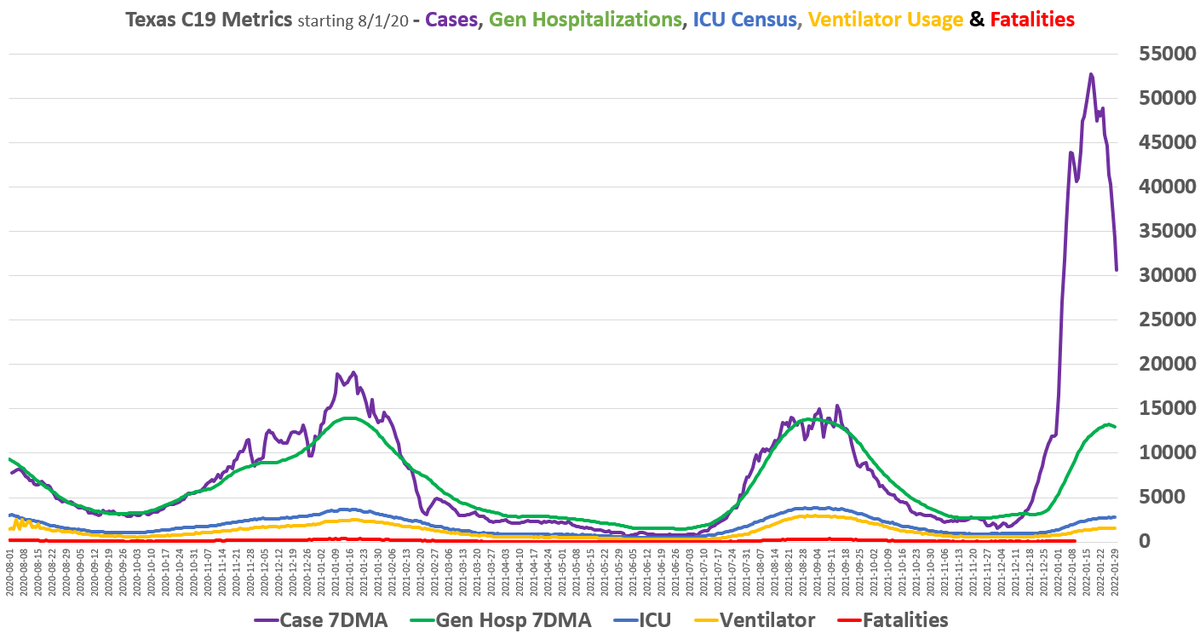
* 1st chart shows Cases vs hospitalizations since 8/2020. This wave was a severe casedemic
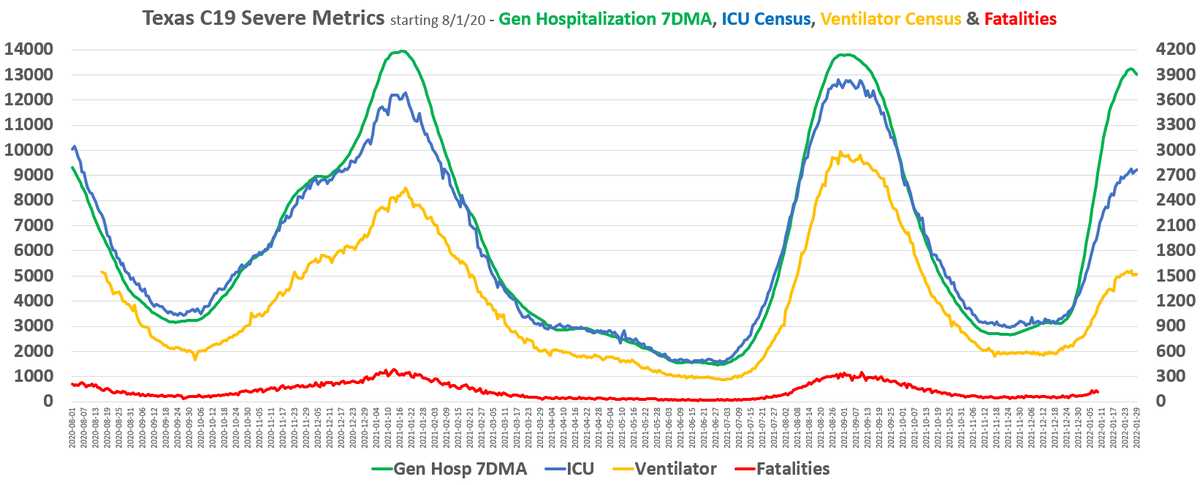
* 2nd chart focuses on hospitalizations. Winter 2021 will be by far be the least severe wave of the four
* 3rd & 4th - 2020 Winter side by sides
5/n


* 1st chart shows Cases vs hospitalizations since 8/2020. This wave was a severe casedemic
* 2nd chart focuses on hospitalizations. Winter 2021 will be by far be the least severe wave of the four
* 3rd & 4th - 2020 Winter side by sides
5/n


2/5 - Conclusion
* Rapidly approaching end of winter wave
* Might see single 1000s tomorrow for reported cases. Thought it would be next week, but its collapsing fast
*Last of the TSA regions are peaking, will soon combine w/ the rest of the state & hospitalizations will plummet
* Rapidly approaching end of winter wave
* Might see single 1000s tomorrow for reported cases. Thought it would be next week, but its collapsing fast
*Last of the TSA regions are peaking, will soon combine w/ the rest of the state & hospitalizations will plummet
• • •
Missing some Tweet in this thread? You can try to
force a refresh


