2/6 - Texas C19 Wave Severity Analysis
THREAD:
Update to last weeks analysis of C19:
* Hospital Census
* ICU
* Vents
* Fatalities
* CFR
1/n
THREAD:
Update to last weeks analysis of C19:
* Hospital Census
* ICU
* Vents
* Fatalities
* CFR
1/n
https://twitter.com/therealarod1984/status/1488192098348281857
2/6 TX Severe outcomes - Page 2
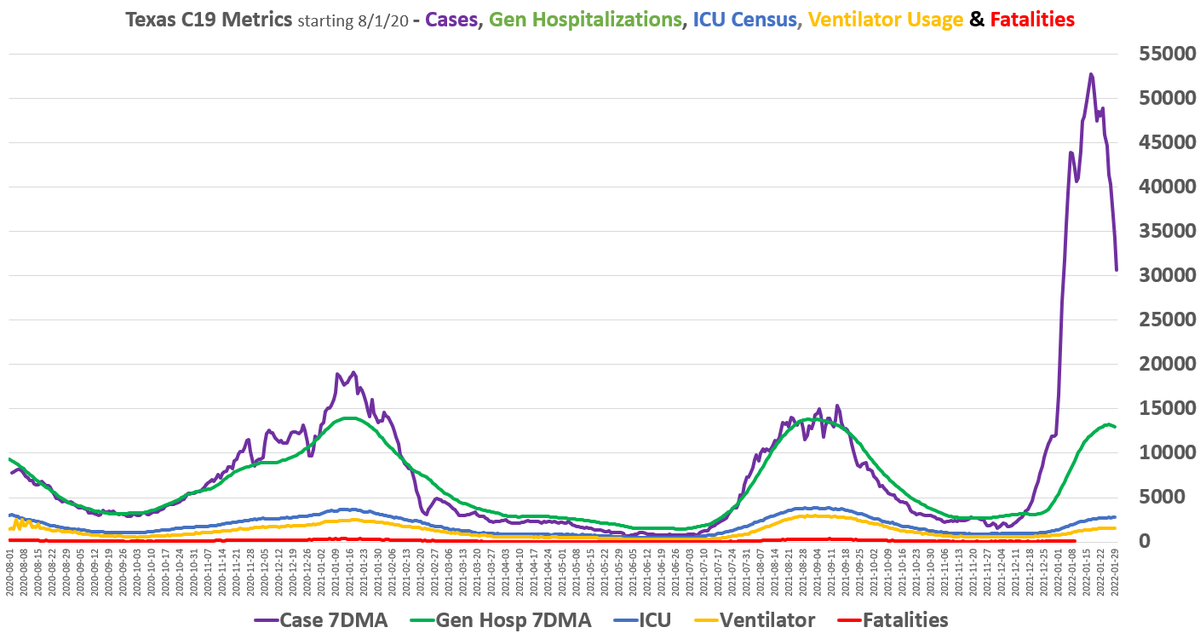
* We'll start with a view of all metrics, including Cases
* 2021 Winter Wave cases declining rapidly from their peak - 280% higher than the previous C19 record
* However, C19 hospital census peaked at only 95% of the previous record
2/n
* We'll start with a view of all metrics, including Cases
* 2021 Winter Wave cases declining rapidly from their peak - 280% higher than the previous C19 record
* However, C19 hospital census peaked at only 95% of the previous record
2/n

2/6 TX Severe outcomes - Page 3
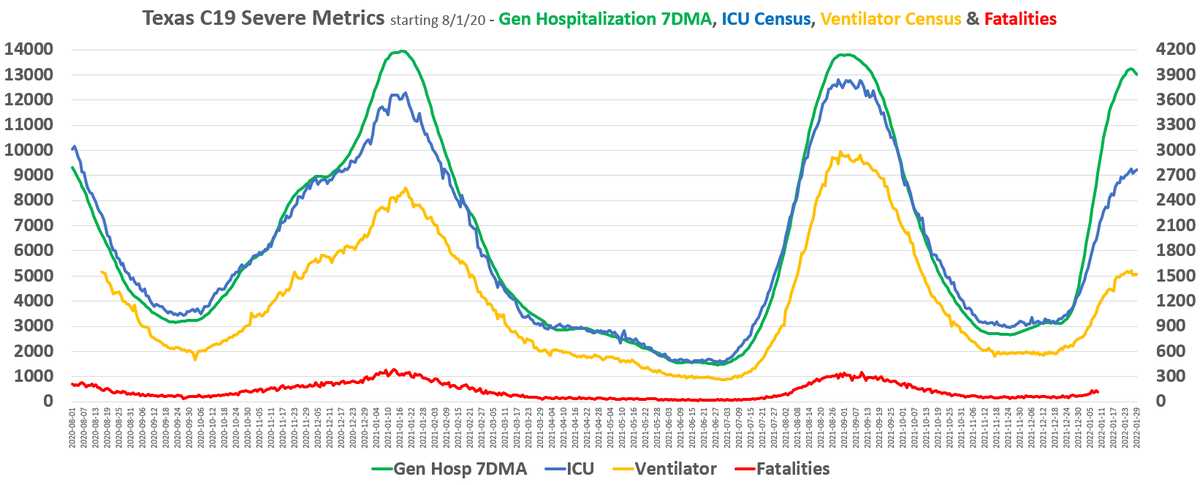
Now just the hospitalization metrics:
* Left axis = hospital census
* Right axis = everything else
* ICU peaked at 72% of the previous record
* Vents peaked at 52% of the previous record
* Fatalities are actual thru 1/1, projected thru 1/15
3/n
Now just the hospitalization metrics:
* Left axis = hospital census
* Right axis = everything else
* ICU peaked at 72% of the previous record
* Vents peaked at 52% of the previous record
* Fatalities are actual thru 1/1, projected thru 1/15
3/n

2/6 TX Severe outcomes - Page 4
* Jan 1st 2 weeks are based on 80-95% of them having been reported, & estimating what is left
* 2nd half of January is TBD, but it looks unlikely we see any day over 300 fatalities. Which lines up with the ICU & Vent #s we already know
4/n
* Jan 1st 2 weeks are based on 80-95% of them having been reported, & estimating what is left
* 2nd half of January is TBD, but it looks unlikely we see any day over 300 fatalities. Which lines up with the ICU & Vent #s we already know
4/n

2/6 TX Severe outcomes - Page 5
* Case Fatality Rate (CFR) is the rate of cases sent to the State DSHS vs Fatalities attributed to C19
* CFR differs from Infection Fatality Rate (IFR) which estimates all infection - asymptomatic, mildly symptomatic, home tests, etc
5/n
* Case Fatality Rate (CFR) is the rate of cases sent to the State DSHS vs Fatalities attributed to C19
* CFR differs from Infection Fatality Rate (IFR) which estimates all infection - asymptomatic, mildly symptomatic, home tests, etc
5/n

2/6 TX Severe outcomes - Page 6
* I tweaked this chart - CFR now by dividing the 7DMA of (today plus the subsequent 6 days of fatalities) over today's Case 7DMA
* It really smoothed out CFR
* CFR is very accurate through Jan 8. Look how it bottomed out first half of Omicron.
* I tweaked this chart - CFR now by dividing the 7DMA of (today plus the subsequent 6 days of fatalities) over today's Case 7DMA
* It really smoothed out CFR
* CFR is very accurate through Jan 8. Look how it bottomed out first half of Omicron.

2/6 TX Severe outcomes - Page 7
* CFR @ 0.3% is significantly less than seasonal flu. Let that sink in
* CFR will stay flat through 2nd week of January and then rise but will stay below 1% for most of the month.
7/n
* CFR @ 0.3% is significantly less than seasonal flu. Let that sink in
* CFR will stay flat through 2nd week of January and then rise but will stay below 1% for most of the month.
7/n

2/6 TX Severe Conclusion
With Cases being 280% of previous record, while ICU/Vents being 72%/52%, I've said it before - Omicron is a casedemic
Will know in a couple of weeks, but fatalities are also looking to come in below previous waves - again despite 280% more cases
8/end
With Cases being 280% of previous record, while ICU/Vents being 72%/52%, I've said it before - Omicron is a casedemic
Will know in a couple of weeks, but fatalities are also looking to come in below previous waves - again despite 280% more cases
8/end
• • •
Missing some Tweet in this thread? You can try to
force a refresh