IS 30K THE BEAR MARKET'S FLOOR?
🧵/1. Looking at the Spot Exchanges (@coinbase, @binance) volume profile throughout 2021-2022, the 30K-35K price range has been a very strong demand area. A #BlackSwan " event aside, this range could be this bear market's bottom.
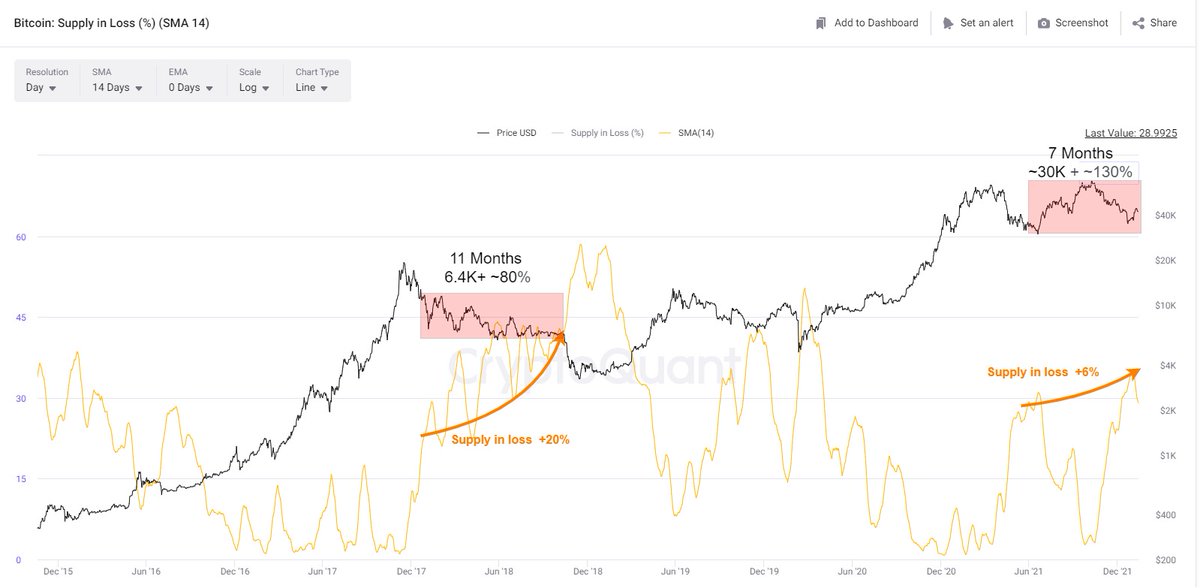
🧵/2. In 2018's bear market, which lasted 11 months, the floor price was ~ $6.4K involving multiple #DeadCatBounce with up to 80% rebounds. During this bearish phase, the % of supply in loss grew +20% due to the BUY/HODL at prices above ~$6.4K.
🧵/3. Assuming the second ATH was a dead cat bouns in a bear market, so far % of supply in loss has grown +6% while we had a +130% rebound to $69K. Therefore, a lengthier bear market is not out of the picture.
🧵/4. WHAT IF A #BlackSwan TAKES PLACE?
There are many possible causes for a black swan occurrence in the market. But what are the possible holding lines, assuming the historical similar events?
🧵/5.
A- Realized Price Multiples
The historical bottoms in the previous bear markets can be mapped using the realized price multiples. Here, the range of 0.7 to 1 X realized price multiples is presented on the charts. These levels are around 16.9K -24K, at the moment.
🧵/6.
B- #MayerMultiple low band
For a nightmare scenario, my favourite bottom model is the low band of the Mayer Multiple; 0.6 X. Historically, #BTC has been lower than 0.6 * 200 MA for almost 3% of its entire history. Currently, this level is showing 29K
🧵/7.
C. 🐳's MVRV
Thanks to my genius friend @bullfromsea, we can track the macro bottoms, using the MVRV of 🐳. Looking at the historical trend the 0.7-0.9 levels have signalled the macro bottoms. Considering the 🐳RP (~ 24.1K), the 16.9K-21.1K levels are possible outcomes.

• • •

Missing some Tweet in this thread? You can try to force a refresh
 

Keep Current with CryptoVizArt.btc 📈 ∞/18M

CryptoVizArt.btc 📈 ∞/18M Profile picture

Stay in touch and get notified when new unrolls are available from this author!

Read all threads

This Thread may be Removed Anytime!

PDF

Twitter may remove this content at anytime! Save it as PDF for later use!

Try unrolling a thread yourself!

how to unroll video
  1. Follow @ThreadReaderApp to mention us!

  2. From a Twitter thread mention us with a keyword "unroll"
@threadreaderapp unroll

Practice here first or read more on our help page!

More from @CryptoVizArt

Dec 5, 2021
SPOOFING; A MYTH OR REALITY
🧵/1. Finally, one of the well-known figures in the community mentioned "SPOOFING" in order books, mainly done through (or by) @binance. But what's spoofing?
Thanks to @woonomic for pointing out the 🐘 in the room.
🧵/2. Spoofing is a disruptive algorithmic trading activity employed by traders to manipulate markets. In an order-driven market, spoofers post a relatively large number of limit orders on one side of the limit order book to make other market participants believe ...
🧵/3. ... that there is pressure to sell (limit orders are posted on the offer side of the book) or to buy the asset with the intent to cancel before the orders are filled. Typical spoofing algorithms are "layering algorithms" and "front-running."
Read 5 tweets
Nov 5, 2021
ARE WE AT DEC 2020 (ROCKET-LUNCH) LEVEL AGAIN?
🧵/1. Here in this 🧵we look at the market structure from #onchain & #FuturesMarket perspectives and compare it with Dec 2020, when the price was breaking above the 2018's (20K) ATH for second time!
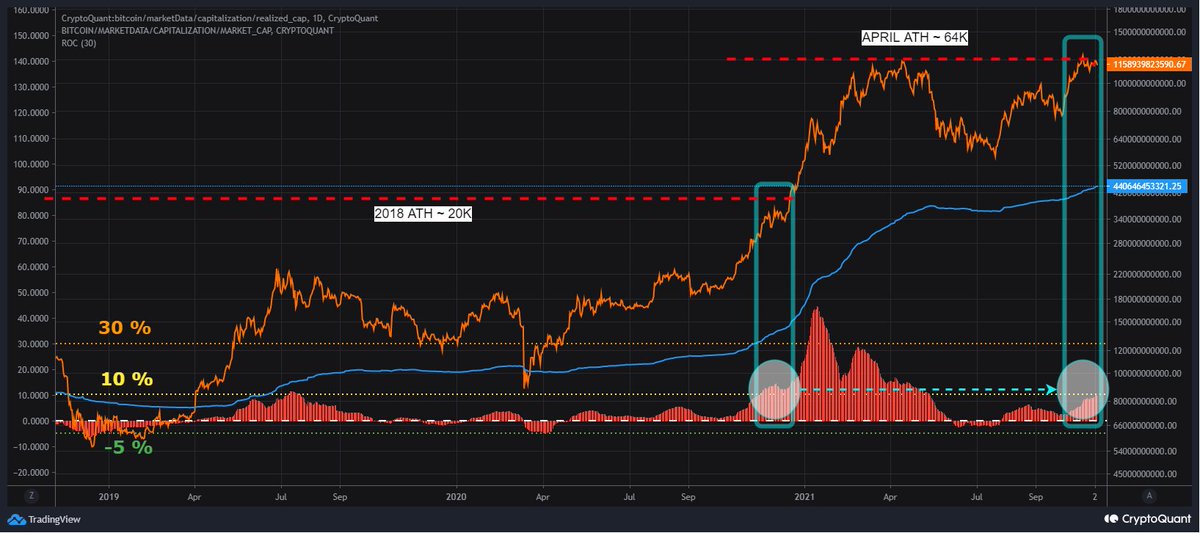
🧵/2. First, looking at the Monthly-Realized Profit Oscillator, we can see, similar to Dec 2020, market is approximately realizing equal to 5% of the total #RealizedCap monthly. This means we have not witnessed the old coins realizing profit at a concerning rate yet ( >10%).
🧵/3. The #FuturesMarket also has the same sentiment that the market had in Dec 2020. The #FundingRate is rising gradually, and #OpenInterest momentum (30D-RSI) has dropped (after reaching a new ATH; 67K) to the same level we saw in Dec 2020; 20K>18K> 🌙(Dec 20) = 67K > 58K > ?
Read 5 tweets
Nov 5, 2021
SELL PRESSURE IN ALL EXCHANGES
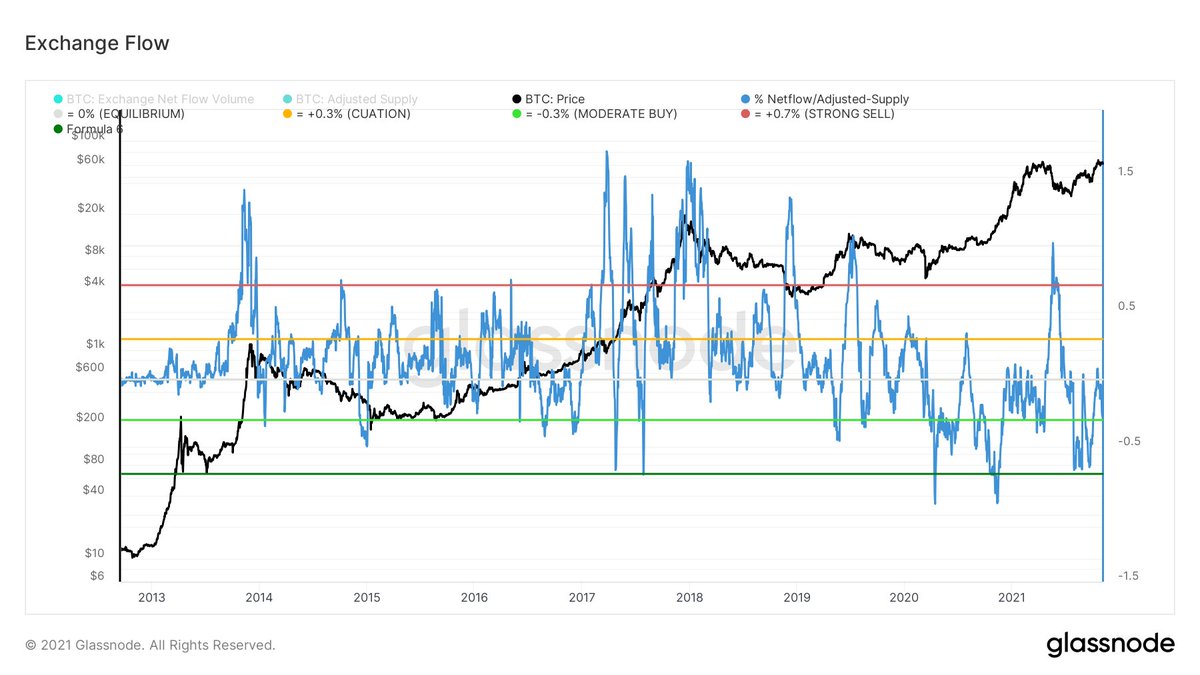
🧵/1.To estimate the intensity of in/outflows to/from all exchanges, we can measure the #NetFlow magnitude as % of adjusted supply (excluding lost & +7 year dormant). Here, I calculated the (30D-aggregated #NetFLow to all exchanges/adjusted supply)
🧵/2. At the market's 2013-14 & 2017-18 tops, we can see the monthly aggregated #NetFlow to all exchanges reached levels above > + 0.75% of adjusted supply.
🧵/3. Reversely, during the bearish periods, we had #NetFlow (withdrawal); - 0.5% to - 0.75%.
Comparing the current market structure with YTD historical data, we can see the #NetFlow levels is similar to Dec 2020 (#BTC ~ 20K); < 0.0%.
Read 5 tweets
Nov 3, 2021
If I had some time, I would try “A network analysis of a Twitter hashtag.” Then you could see how ridiculous is #shitcoin marketing! First, main accounts start the #XYZ, then so-called genius TAs (famous) promote the new life-changing coin with their charts. SURE it will pump! Image
زمان اضافه‌ای اگر داشتم، با یک مطالعه دقیق ثابت می‌کردم، چطور به صورت سازمان‌ یافته معروف‌ترین اکانت‌های #تکنیکال #شتکوین ی (حتی فارسی زبان) ، سیگنال‌ها رو خودآگاه یا ناخودآگاه، از یک منبع مشترک می‌گیرند. البته که پامپ خواهد شد! اما تاخیر زمانی پیوستن شما به این موج خنده‌دار است
This is a simple article to show how you can study the network
cguibourg.wordpress.com/2015/05/04/tut…
Read 5 tweets
Aug 6, 2021
به خدای بزرگ قسم که هیچ دِینی بر دوش شما نیست بابت کار کوچکی که می‌کنم. این وظیفه من در مورد کشورم و هموطنانم است.
اما دلم پر از درد است که ساعت‌ها تلاش‌ می‌کنم. با اشتیاق هزینه فکری و مالی بر خودم تحمیل می‌کنم.
با ۲-۳ شرکت مکاتبه می‌کنم که منت تحریم و ایرانی بودن را بر سر ما می‌گذارند. عملا التماس می‌کنم برای رایگان کردن بخشی از اطلاعاتشان !
در جواب می‌بیینم، مردم پول در جیب حرام لقمگانی می‌ریزید که فخر ماشین و ساعتشان را به شما می‌فروشند.
دروغ‌هایِ این بی شرافتان‌ را که از مسیر خوردن خون شما، اعتبار کسب کرده‌اند، می‌خرند. کسانی که دیروز در اینستاگرام و امروز در منوتو و فردا … خدا داند کجا، پروموت می‌شوند.
بدانید از این پیشنهادها و قول پول‌ها به افراد پر مخاطب زیاد انجام می‌شود.
Read 6 tweets
Aug 3, 2021
🧵/1-Due to the innovative approach towards #BTC price valuation based on #Scarcity, the #S2F model by @100trillionUSD has attracted a lot of attention in the community since 2019. After the recent market's 50% drop, the S2F_price deflection from Market_price caused a huge debate
🧵/2- I have two theories for this descending behaviour in the #S2F deflection graph.
A- The #S2F model is only a function of Scarcity. However, Scarcity can be exaggerated/neutralized by other factors such as wealth distribution's equality in the network; Gini Coeff
🧵/3- Therefore, if we redefine the S2F model to include the Gini Index, we can improve the price prediction performance (lower deflection). Gini Coeff calculation requires T3 data offered by @glassnode (I don't have them)
news.earn.com/quantifying-de…
Read 9 tweets

Did Thread Reader help you today?

Support us! We are indie developers!


This site is made by just two indie developers on a laptop doing marketing, support and development! Read more about the story.

Become a Premium Member ($3/month or $30/year) and get exclusive features!

Become Premium

Don't want to be a Premium member but still want to support us?

Make a small donation by buying us coffee ($5) or help with server cost ($10)

Donate via Paypal

Or Donate anonymously using crypto!

Ethereum

0xfe58350B80634f60Fa6Dc149a72b4DFbc17D341E copy

Bitcoin

3ATGMxNzCUFzxpMCHL5sWSt4DVtS8UqXpi copy

Thank you for your support!

:(