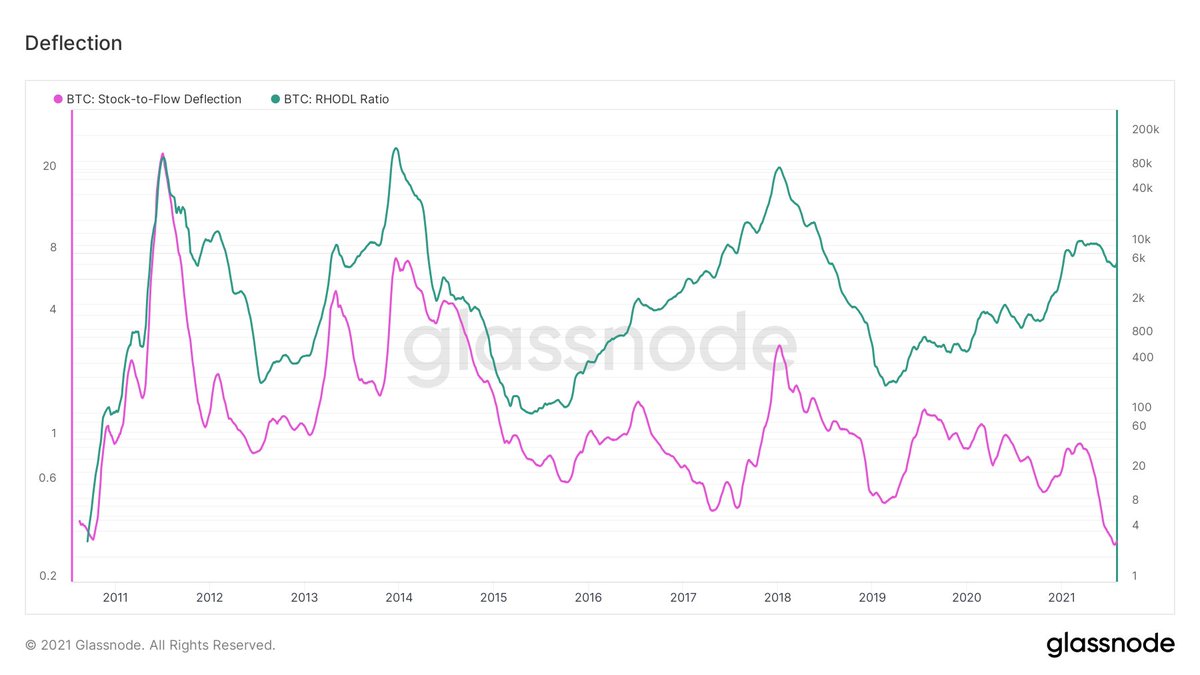
🧵/1-Due to the innovative approach towards #BTC price valuation based on #Scarcity, the #S2F model by @100trillionUSD has attracted a lot of attention in the community since 2019. After the recent market's 50% drop, the S2F_price deflection from Market_price caused a huge debate
🧵/2- I have two theories for this descending behaviour in the #S2F deflection graph.
A- The #S2F model is only a function of Scarcity. However, Scarcity can be exaggerated/neutralized by other factors such as wealth distribution's equality in the network; Gini Coeff
🧵/3- Therefore, if we redefine the S2F model to include the Gini Index, we can improve the price prediction performance (lower deflection). Gini Coeff calculation requires T3 data offered by @glassnode (I don't have them) news.earn.com/quantifying-de…
🧵/4- An alternative for the Gini index to gauge the distribution dynamic in the market, we can employ #RHODLRatio by @glassnode. If we compare the RHODL Ratio and S2F deflection ratio, you would see an obvious correlation there.
🧵/5- This correlation shows that #S2F deflection (so do S2F price) is a function of wealth distribution equality as well as wealth scarcity.
B- The second explanation could be the error in Scarcity calculation.
🧵/6- @100trillionUSD defined Scarcity as Stock (circulating supply)/Flow (issuance rate) in his article. Where the Issuance rate is perfectly administrated/set by the network. However, the circulating supply in PlanB’s model is only adjusted by 1 Million Satoshi’s coins.
🧵/7- The lost coins are not considered in Scarcity calculation. The best source for lost supply is the #AdjustedSupply offered by @Glassnode (Coins that were active +7 years ago are subtracted from the total supply). Here you can see the total supply( ⚫️) vs AdjustedSupply (🔵).
🧵/8- Recalculating the Scarcity = Stock/Flow by #AdjustedSupply (instead of Total Supply - Saoshi's #BTC) can lead to some improvements in #S2F model price prediction as well.
1/10-Going through the 2nd week of the biggest corrections of this cycle (~ 50%), the ultimate questions in market are,
-Whether the cycle is over?
-How are the Exchange Flow conditions?
-What is the picture that on-chain metrics are giving about market in long-term?
🧵🔽
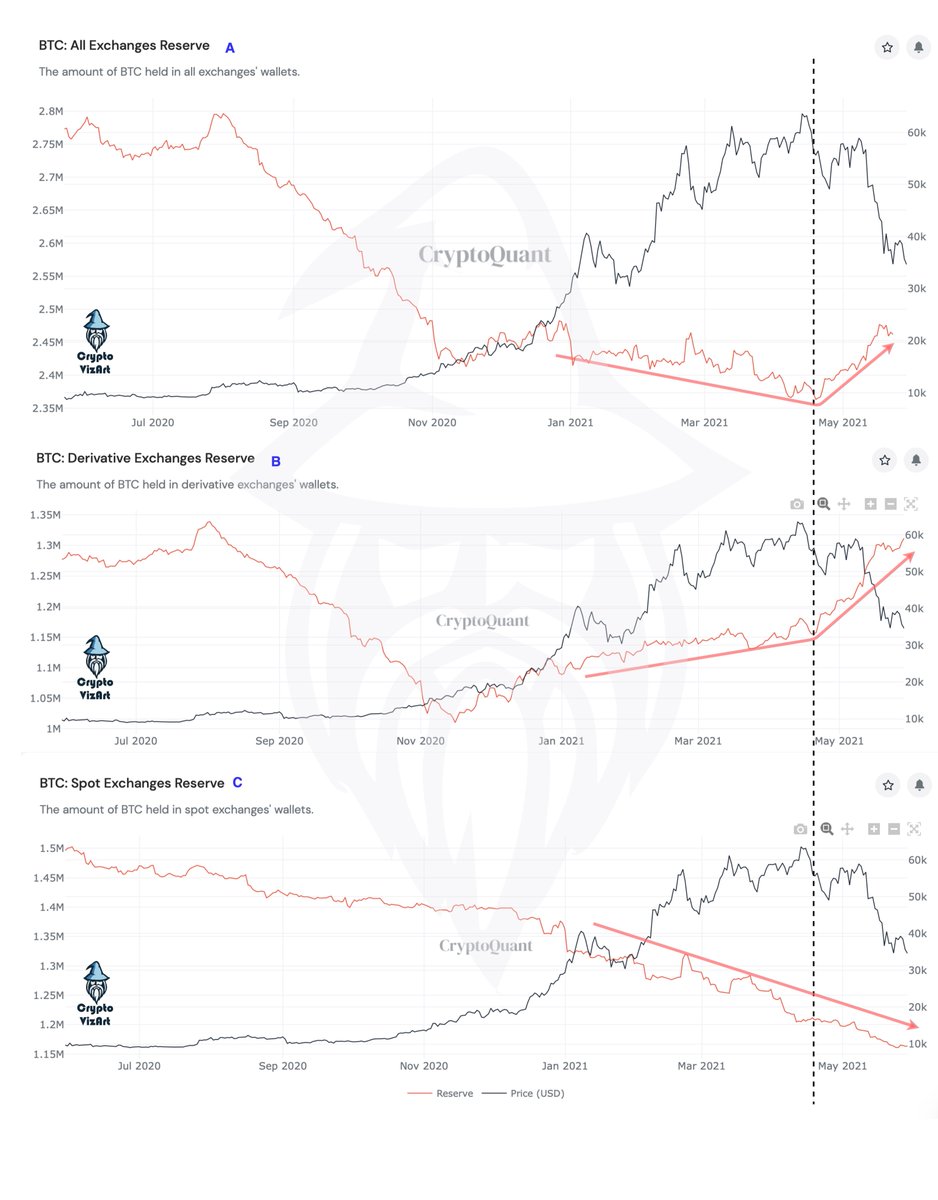
2/10- All-Exchanges Reserve has been declining since the beginning of this bull market. This trend was then upward on April 24th after prices dropped 64K > 50K [1A] = on-chain bearish sign.
3/10-Overall increasing level of bitcoin reserve on exchanges was due to Derivative-Exchanges (@Binance, @Bitrex )[1B]. The interesting point to notice here was the uninterrupted downtrend of bitcoin reserve on Spot-Exchanges (@Coinbase, @Kraken)[1C].
The big players are setting their limit-buy in spot at 20-23 K and the same time opening their future-short position at +32K. I, on be half of all #hodlers, want to say FUCK you and all other TOP 1% friends of yours.
گرگهای کثیف در حال برنامه چیدن برای هفته آخر این ماه هستند. این فاسدان دنیای دلاری تا تکتک ساتوشیهای شما را از دست شما خارج نکنند، آرام نخواهند نشست.
So far we haven't seen the alarming (> 7000 BTC hourly) Net flow to all exchanges. Let's see what's next ! @cryptoquant_com
1/5- Cycle Distribution/Accumulation Behavioral Analysis
What is the current cycle looking like 2017 or 2013's?
First, let's check out the #RealizedHODLWave charts over last two weeks. As you notice, the 1-30 day-old coins (newcomers) has dropped 4.8%.
2/5- In contrast, the supply portion of 3-24 month-old coins did grow 4% (experienced speculators). This confirms that the aggregated behavior of #LT_HODLERS has not changed in the recent correction.
3/5- A macro picture of the accumulation/distribution patterns previous cycles is shown here. As you see, similar to 2013-cycle, the attractive price hike at the beginning of the bull run has caused a fast growth in new investors-owned portion of the supply (red line double tops)
تشکر رضا جان بابت این سوال عالی ...
۱- دو مدل معروف برای تخمین این ارزش واقعی #بیتکوین از بازارهای مالی دیگر وجود دارد.
مدل اول، #S2F که مبنای محاسباتش، ذات #بیتکوین در ذخیره ارزش است؛شبیه طلا. این مدل ارزش حال بیتکوین را ۱۰۰ هزار دلار میداند.
۲- مدل دوم، ارزش #بیتکوین را از روی حجمی دلاری که بر بستر شبکه آن منتقل میکنند، محاسبه میکند. مشابه شرکت #paypal یا #Visa !
این مدل، #NVT، قیمت واقعی یا ارزش #بیتکوین را ۵۵ هزار دلار تخمین میزند.
حال این انتخاب شماست که مدلهای ریاضی را مبنا قرار بدهید یا صرفا «حس» شخصی.
بررسی روند هفتگی بازار و تلاش برای پاسخ به سوال #کجای_چرخه_هستیم از دیدگاه #تحلیل_پایه دادههای #onchain
⁃کاهش حباب خطرناک قیمت #بیتکوین نسبت به ارزش و تشخیص مرحله کنونی در روند صعودی
⁃ادامه روند #HODL کردن، دارندگان بلندمدت بازار و ماینرها #SmartMoney
۱- در ابتدا با نگاهی به معیار #MVRV (نمایانگر حباب قیمت-ارزش)، روند کاهش اندازه حباب #بیتکوین درچند هفته اخیر را بررسی خواهیم کرد. این معیار قبل از تثبیت در محدوده تاریخی هیجانی ( >۷)🟥، همزمان با ریزش قیمت از ۶۴ هزار، کاهشی معقولی داشته ...
در حال تهیه یک گزارش چند بندی هستم، که به اشتراک خواهم گذاشت. بر خلاف خط مشی غیرسیگنالی بنده، عرض کنم؛
با فرض شباهت دلیل حرکات اخیر بازارسازها روی شبکه، با انگیزه پشت همین حرکات در بازار ۲۰۱۷؛ #آلتکوین ها و میزان سوددهی شان (در بازه ۱-۳ ماه) صورتتان را آب خواهد کرد !
🔴🔴 دوستان لطفا با این جمله بنده در بازار اصطلاحا انتحاری وارد نشوید. امکان اصلاح حتما وجود دارد. روی سخن بالا با افرادی ایست که در spot معاملات اصلی خودشان را با مطالعه شخصی خود انجام میدهند. صرفا برای کم شدن فشار روانی دوستان تازهواردی که احتمالا در ضرر هستند، عرض کنم #HODL
"it will melt your face" 's definition in reality :)