2/19 Texas C19 Update - Exit Stage Left

THREAD

* Probably one mid week report left, and then I'll go to once a week to keep my eyes on things
* Everything still collapsing
* Let's take a look!

1/n
.
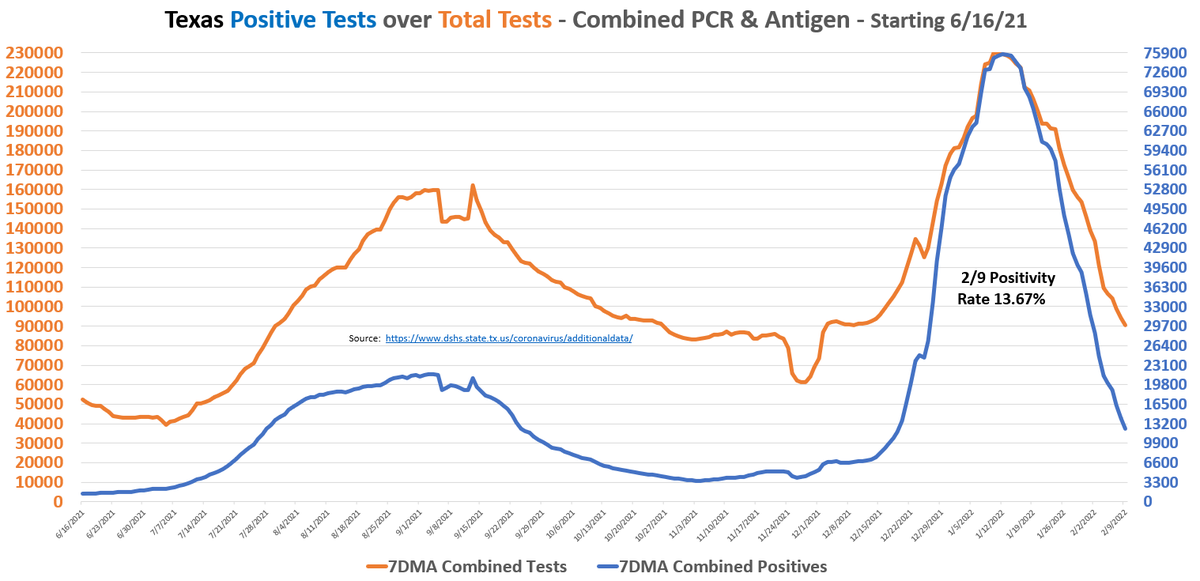
2/19 -Test reporting is by date of specimen collection, you have to wait ~10 days for a date to be ~90-95% in.

As of 2/9:

* Positivity rate down to 13.67%, and from here the decline starts to slow
* An interesting bump in testing occurred 2/10-2/14, but its falling again

2/n
2/19 - Cases are simply reported as they are received by the counties.

Case 7DMA
* now down to 6.6K
* has been down 1/3rd to 1/2 from the previous week (WoW) for 21 straight days
* Cases down 87% from peak

3/n
.
2/19 - Hospitalizations

* Covid Admissions decline still accelerating, down 30.1% week over week (WoW)
* Covid % of total beds down to 8.82%
* 2020 Winter still 24 more days of growth in the comparison
* Covid General Census 7DMA down 26.2% WoW

4/n
.
2/19 Severe Hospitalizations

* Same comments as 2/15 - At this point, it goes without saying that Winter 2021 wasn't nearly as severe as previous waves.
* ICU & Vent numbers are in rapid decline
* The 2020 vs 2021 Comparison charts, 2020 has a ton of growth still to go

5/n
2/19 - Conclusion

* It's basically over people. Time to go home. LOL
* I'll do a 2/20 Severity/Fatality update because that is still interesting - we are looking right into hospital peak and just after.
* Enjoy the rest of your weekend!

6/end

• • •

Missing some Tweet in this thread? You can try to force a refresh
 

Keep Current with therealarod1984

therealarod1984 Profile picture

Stay in touch and get notified when new unrolls are available from this author!

Read all threads

This Thread may be Removed Anytime!

PDF

Twitter may remove this content at anytime! Save it as PDF for later use!

Try unrolling a thread yourself!

how to unroll video
  1. Follow @ThreadReaderApp to mention us!

  2. From a Twitter thread mention us with a keyword "unroll"
@threadreaderapp unroll

Practice here first or read more on our help page!

More from @therealarod1984

Feb 21
2/20 - Texas C19 Wave Severity Analysis

THREAD:

Analysis of severe hospitalizations and outcomes for the Winter 2021 Omicron wave. Updates for:

* Hospital Census
* ICU
* Vents
* Fatalities & CFR - can confidently project Jan 28 as the fatality peak for this wave

1/n
2/20 TX Severe outcomes - Page 2

* Numbers through 2/19, Cases 7DMA falling through 6K per day
* Hospitalization Census 7DMA also into the 6K range and still falling fast
* While 2020 Winter wave was 5 months long from end to end, 2021 Winter will be less than 3

2/n Image
2/20 TX Severe outcomes - Page 3

Now just the hospitalization metrics on a two axis chart:

* Peaks for this wave were 95% of previous Census record, 73% of ICU, and 52% of Vents
* Not only that, but the waves were shorter in length. Aggregates should be even less

3/n Image
Read 8 tweets
Feb 16
2/16 - Texas C19 Wave Severity Analysis

THREAD:

Analysis of severe hospitalizations and outcomes for the Winter 2021 Omicron wave. Updates for:

* Hospital Census
* ICU
* Vents
* Fatalities & CFR - projecting into hospitalization peak now

1/n
2/16 TX Severe outcomes - Page 2

* Numbers through 2/15, Cases falling through 8K per day
* Hospitalization Census into the 7K range and falling fast
* Crazy high case peak, while hospitalizations were less than previous waves...

2/n
2/16 TX Severe outcomes - Page 3

Now just the hospitalization metrics on a two axis chart:

* All the hospitalization metrics in freefall
* Notice again how much smaller this ICU/vent peak is than previous Covid waves
* Fatalities are actual thru 1/11, projected thru 1/25

3/n
Read 8 tweets
Feb 16
2/15 Texas C19 Update - Omicron go Night Night...

THREAD

* Cases running north of 100% of positive tests, meaning we are seeing a lot of catch up and backlog being reported
* Despite this, Case 7DMA now below 9K
* Hospitalizations, including ICU/Vents continue freefall

1/n
.
2/15 -Test reporting is by date of specimen collection, you have to wait ~10 days for a date to be ~90-95% in.

As of 2/5:

* Pos rate 7DMA down to 18.78% & declining a point a day
* More cases being reported than there are positive tests, starting 2/3 & next several days

2/n
2/15 - Cases are simply reported as they are received by the counties.

Case 7DMA
* now down to 8.7K
* has been down 1/3rd to 1/2 from the previous week (WoW) for 17 straight days
* The decline is slowing because reporting per 2/n and there is little room to fall now.

3/n
.
Read 6 tweets
Feb 11
2/10 - Texas C19 Wave Severity Analysis

THREAD:

For the next couple of weeks will step up to 2X a week analysis of of C19:

* Hospital Census
* ICU
* Vents
* Fatalities
* CFR

Mostly because I'm interested in what the final numbers look like for Omicron. Lucky you, LOL!

1/n
2/10 TX Severe outcomes - Page 2

* This first one and the CFR Chart are the pictures of Omicron.
* A rapid rise and fall
* Cases 280% higher than the previous C19 record, but hospitalizations lower than previous waves, especially the critical care hospitalizations.

2/n
2/10 TX Severe outcomes - Page 3

Now just the hospitalization metrics on a two axis chart:

* Omicron was more gentle while blowing up the Mandate paradigm
* C19 ICU peaked at 72% of the previous record, Vents at 52%
* Fatalities are actual thru 1/4, projected thru 1/18

3/n
Read 9 tweets
Feb 10
2/9 Texas C19 Update - For what it's worth

* While the dam is breaking on mandates and I hope they wash away in a flood,
* Still going to monitor the collapse of Omicron throughout the state
* Good riddance, yet Thank You Omicron, and here's why...

THREAD

1/n
.
2/9 - Test reporting is by date of specimen collection, you have to wait ~10 days for a date to be ~90-95% in.

As of 1/30:

* Positivity rate 7DMA had declined to 25% and was about to start losing a point a day, every day
* Feb testing numbers will be a straight line down

2/n
.
2/9 - Cases are simply reported as they are received by the counties.

Case 7DMA
* now down to 13.8K
* has been down 1/3rd or more from the previous week (WoW) for 11 straight days
* Today down 50% WoW - a 1st in 2 years of watching (outside of winter storms or holidays)

3/n
.
Read 6 tweets
Feb 8
2/7 Texas C19 Update - Plummet

* Steep Declines everywhere
* We're about halfway down the hill
* Will be interesting to far down this does or doesn't bottom out

THREAD

1/n
2/7 - Test reporting is by date of specimen collection, you have to wait ~10 days for a date to be ~90-95% in.

As of 1/28:

* Huge plunge underway across testing, positivity rate & positive tests
* Upcoming incomplete days show a decline of ~1% a day in positivity rate

2/n
. ImageImageImageImage
2/7 - Cases are simply reported as they are received by the counties.

* Cases 7DMA re-enters somewhat normal Covid territory @ 18K
* 7DMA rate of week over week decline continues in the mid 30s %, now 9 consecutive days. Unprecedented rate of decline.

3/n
. ImageImageImageImage
Read 6 tweets

Did Thread Reader help you today?

Support us! We are indie developers!


This site is made by just two indie developers on a laptop doing marketing, support and development! Read more about the story.

Become a Premium Member ($3/month or $30/year) and get exclusive features!

Become Premium

Don't want to be a Premium member but still want to support us?

Make a small donation by buying us coffee ($5) or help with server cost ($10)

Donate via Paypal

Or Donate anonymously using crypto!

Ethereum

0xfe58350B80634f60Fa6Dc149a72b4DFbc17D341E copy

Bitcoin

3ATGMxNzCUFzxpMCHL5sWSt4DVtS8UqXpi copy

Thank you for your support!

:(