2/9 Texas C19 Update - For what it's worth
* While the dam is breaking on mandates and I hope they wash away in a flood,
* Still going to monitor the collapse of Omicron throughout the state
* Good riddance, yet Thank You Omicron, and here's why...
THREAD
1/n
.
* While the dam is breaking on mandates and I hope they wash away in a flood,
* Still going to monitor the collapse of Omicron throughout the state
* Good riddance, yet Thank You Omicron, and here's why...
THREAD
1/n
.
https://twitter.com/therealarod1984/status/1491047638611132416
2/9 - Test reporting is by date of specimen collection, you have to wait ~10 days for a date to be ~90-95% in.
As of 1/30:
* Positivity rate 7DMA had declined to 25% and was about to start losing a point a day, every day
* Feb testing numbers will be a straight line down
2/n
.


As of 1/30:
* Positivity rate 7DMA had declined to 25% and was about to start losing a point a day, every day
* Feb testing numbers will be a straight line down
2/n
.


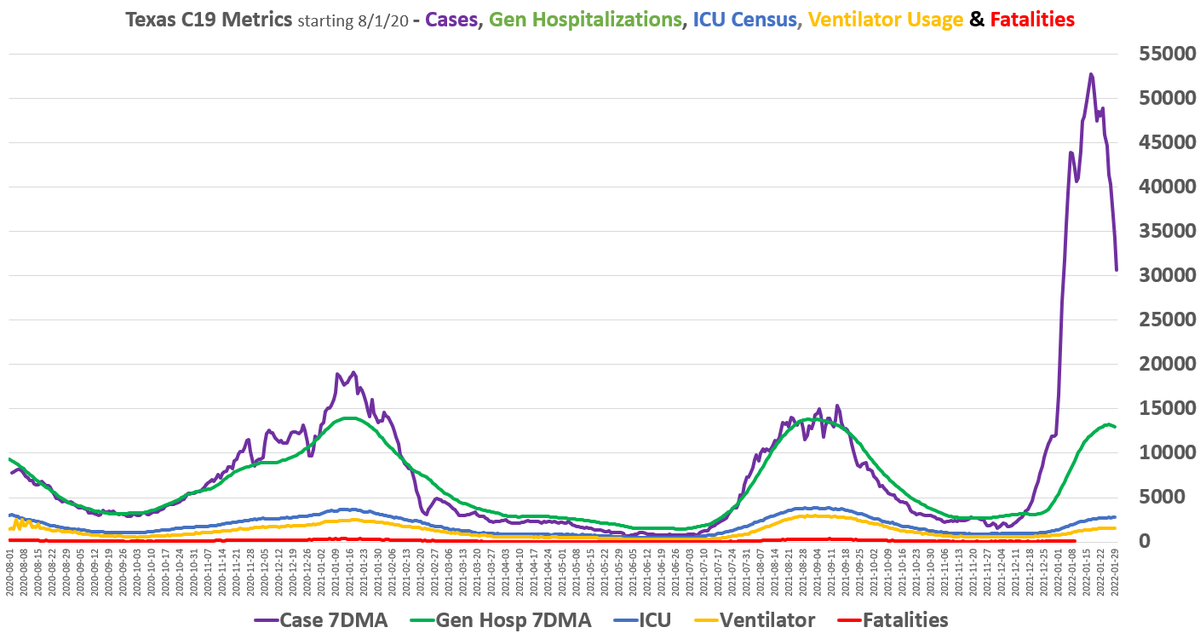
2/9 - Cases are simply reported as they are received by the counties.
Case 7DMA
* now down to 13.8K
* has been down 1/3rd or more from the previous week (WoW) for 11 straight days
* Today down 50% WoW - a 1st in 2 years of watching (outside of winter storms or holidays)
3/n
.


Case 7DMA
* now down to 13.8K
* has been down 1/3rd or more from the previous week (WoW) for 11 straight days
* Today down 50% WoW - a 1st in 2 years of watching (outside of winter storms or holidays)
3/n
.


2/9 - Hospitalizations
* Covid Admissions free fall continues to accelerate, 7DMA now down 28% week over week (WoW)
* Covid General Census 7DMA down 18% WoW, and there's more where that came from
* Covid % of total beds below 15% at 14.91%
4/n
.


* Covid Admissions free fall continues to accelerate, 7DMA now down 28% week over week (WoW)
* Covid General Census 7DMA down 18% WoW, and there's more where that came from
* Covid % of total beds below 15% at 14.91%
4/n
.


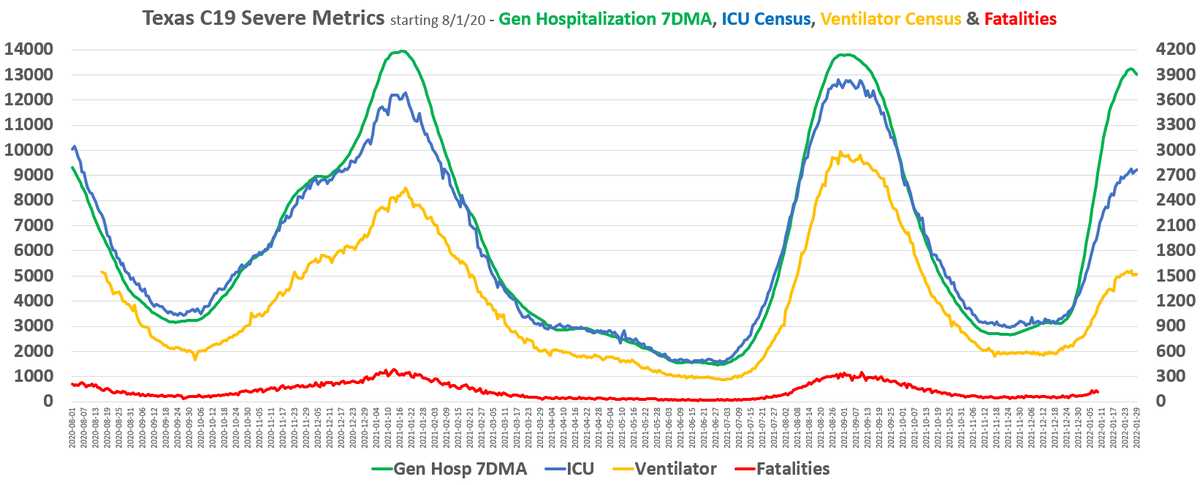
2/9 Severe Hospitalizations
* Same comments as 2/7:
* ICU & Vent peaks by far the lowest of any wave
* ICU & Vent in steep decline
* 2020 Winter ICU & Vent comparisons to 2021 will be very favorable towards 2021 in regards to outcomes. 2020 #s will leave 2021 in the dust
5/n


* Same comments as 2/7:
* ICU & Vent peaks by far the lowest of any wave
* ICU & Vent in steep decline
* 2020 Winter ICU & Vent comparisons to 2021 will be very favorable towards 2021 in regards to outcomes. 2020 #s will leave 2021 in the dust
5/n


2/9 - Conclusion
* Buh Bye Omicron
* Yours was a bright but brief appearance on the Covid stage
* But I thank Omicron for finally laying waste to the Zero-Covid Paradigm, for virusing through Covid Mandate Theater, & for exposing Vaxports as sheer Idiocracy!
6/end
* Buh Bye Omicron
* Yours was a bright but brief appearance on the Covid stage
* But I thank Omicron for finally laying waste to the Zero-Covid Paradigm, for virusing through Covid Mandate Theater, & for exposing Vaxports as sheer Idiocracy!
6/end
• • •
Missing some Tweet in this thread? You can try to
force a refresh


