Sectoral View for Next Weeks

Nifty IT :

Nifty It at Stage 3 Topping Phase
Looks Good For Stage 4
At Important Support

Nifty METAL : No Major Movement Expected
Could be either ways as it is trading in center of Range

Retweet and Share !
1/n
Nifty REALTY : A structure of LL LH , Looks good for a dip Upside Bounces likely to be sold off

Nifty PSU : A Structure in channel May dip Temporary but overall Buy on Dips Structure
in Stage 2 Uptrend and trading near trendline support

Nifty PHARMA : At Immediate Support
2
Nifty FMCG : LH LL Structure , Overall Sell on Rise
Nifty AUTO: Looks Good for Upside and Overall Strength Seen
3/n
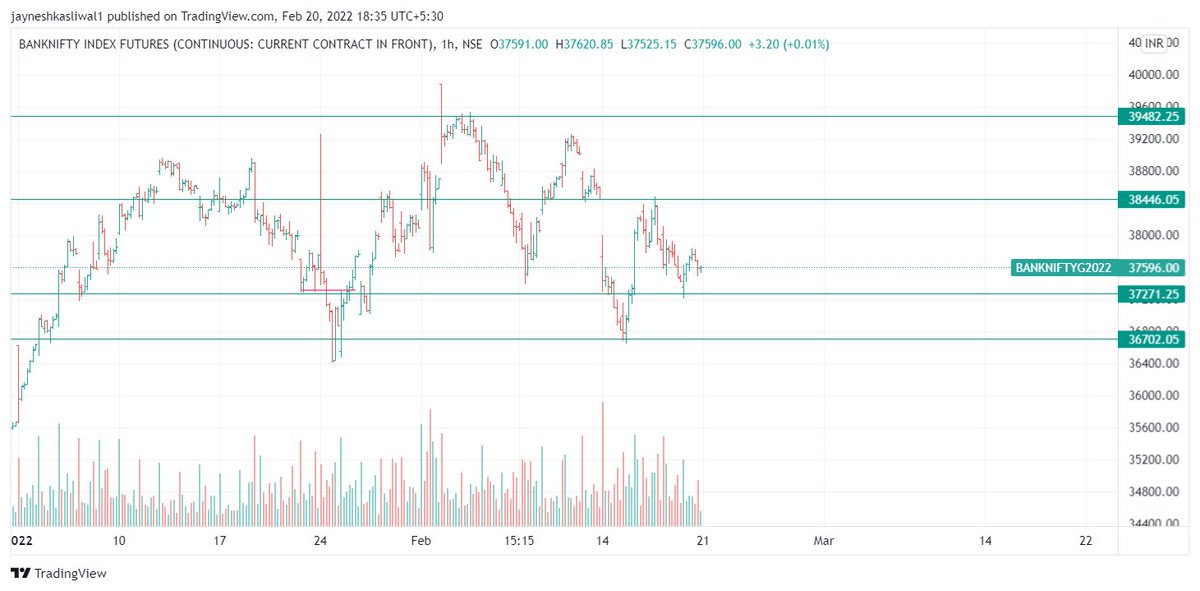
NIFTY , BANKNIFTY , SMALLCAP , MIDCAP
3/n

• • •

Missing some Tweet in this thread? You can try to force a refresh
 

Keep Current with JayneshKasliwal

JayneshKasliwal Profile picture

Stay in touch and get notified when new unrolls are available from this author!

Read all threads

This Thread may be Removed Anytime!

PDF

Twitter may remove this content at anytime! Save it as PDF for later use!

Try unrolling a thread yourself!

how to unroll video
  1. Follow @ThreadReaderApp to mention us!

  2. From a Twitter thread mention us with a keyword "unroll"
@threadreaderapp unroll

Practice here first or read more on our help page!

More from @JayneshKasliwal

Feb 21
A Small Thread on Breakouts

What is Breakout ?
A breakout is a stock price moving outside a defined support or resistance level with increased volume.
Always trade breakouts in uptrend for high win ratios

Retweet and Share :)
1/n
Source : Google Image
What to Look before entering a breakout ?
Look for Volume Spikes on Up days and Down Volume on down days.
Simply Volume Should Dry during Pullbacks
This is a sign of Accumulation by Bigger Sharks.
As they buy in huge quantities they have to buy in parts to avoid price spikes
2/n Image
They dont only buy on Uptrend but continue holding during pullbacks for bigger gains .
Important thing is pullbacks should always have less volumes .
3/n ImageImage
Read 11 tweets
Feb 21
Intraday System Sell call Below 37820 5 Min closing Image
100 points done
200 Points Down
Read 4 tweets
Feb 16
3 Ways to Ride the Complete Trend in a Stock

1. Supertrend
2. Moving Averages
3. Relative Strength

A Thread🧵 With Examples

Retweet Comment and Share :)
SuperTrend :
It is TrendFollowing Indicator That generates Buy / Sell signals based on the ATR value or volatility of the stock

Supertrend also works as a trailing stop-loss for the existing trades Best on daily time frame
2/n
Supertrend Conditions
Works Best on 10 , 3 settings
One can try and backtest on 10 ,2 at own also !
Doesnt Work well in Sideways Zone as it is trend following indicator

3/n
Read 13 tweets
Feb 14
Trend Analysis using moving averages !
A mega thread to understand the Use of 21 , 50 and 200 ema.
4 Effective uses of Exponential Moving Averages !
Which can Help you avoid Big Losses

Retweet and Share :)
#stockmarkets #nifty
Popular uses of moving averages

1. Identifying the direction of trend
2. MA crossover
3. Dynamic Support and Resistance
4. Price Crossing above Key EMAs

Note : In chart 21 ema is red , 50 ema is green and 200 ema is black

2/n
Why EMA and not SMA ?
EMA is fast , accurate and prices in recent data !
We are using EMAs on Daily time Frame
Red: 21 , Green : 50 and Black :200
3/n
Read 15 tweets
Feb 13
Understanding STAGE ANALYSIS
I read one of the greatest Trading Books so that You dont have to !🧵

Secrets of Profiting in Bull and Bear Markets
by Stan Weinstien

Retweet and Share !
Comment Yes for another Book Summary :)
Stan Weinstein's Stage Analysis offers traders a powerful methodology to identify trends in the markets while following strict risk management principles.
Stage Analysis is used to identify the longer-term trend of a stock or index. There are 4 different stages

1/n
✅The Basing Area,
✅Advancing Phase
✅The Top Area
✅Declining Phase

2/n
@kuttrapali26 @AdityaTodmal @aditya_kondawar @Rishikesh_ADX @ProdigalTrader
Read 15 tweets
Feb 12
How to Draw
Support , Resistance and Trendlines ?
A Foundation of Stock Market !

A Thread 🧵
Retweet and Share :)
What is Support and Resistance ?

⏫Support is an area for price , where it halts due to demand of the stock at that price .

⏬Resistance is an area for price ,where it halts due to Supply of the stock at that price .
1/n
How to Draw S/R ?

You can use Any time frame for Drawing S/R and it works on all time frames .

Whenever the Price Reverses from an area for more than 2 times that area can be called as S/R .

You can use Line Tool Or Rectangle tool to plot this on charts .

2/n
Read 13 tweets

Did Thread Reader help you today?

Support us! We are indie developers!


This site is made by just two indie developers on a laptop doing marketing, support and development! Read more about the story.

Become a Premium Member ($3/month or $30/year) and get exclusive features!

Become Premium

Don't want to be a Premium member but still want to support us?

Make a small donation by buying us coffee ($5) or help with server cost ($10)

Donate via Paypal

Or Donate anonymously using crypto!

Ethereum

0xfe58350B80634f60Fa6Dc149a72b4DFbc17D341E copy

Bitcoin

3ATGMxNzCUFzxpMCHL5sWSt4DVtS8UqXpi copy

Thank you for your support!

:(