Macd is the simplest & most reliable indicators available. Macd uses Moving Averages & turn them into momentum indicator by subtracting longer MA from shorter MA. The subtracted value when plotted forms a line that oscillates above & below zero, without any upper/ lower limits. 

Using shorter Moving Average (5 & 10) will produce a quicker, more responsive indicator (fast macd), while using longer MA (12 & 26) will produce a slower indicator (Slow macd), less prone to whipsaws.
Macd measures the difference between two Exponential Moving Averages (EMAs).
Macd measures the difference between two Exponential Moving Averages (EMAs).
A +ve Macd indicates that 5 or 12-day Ema is trading above 10 or 26-day Ema. A -ve Macd indicates that 5 or 12-day Ema is trading below 10 or 26-day Ema. If Macd is -ve & declining, then -ve gap between faster MA & slower MA is expanding & Downward momentum is accelerating..

Investors: with huge portfolio use week macd to spot -ve div. to "Part Book" once & during Bearish Cross over 2nd "Part book" & last one at Bearish centreline crossover. Start buying in parts when +ve div. start & add more with Bullish cross over & Bullish centreline crossover

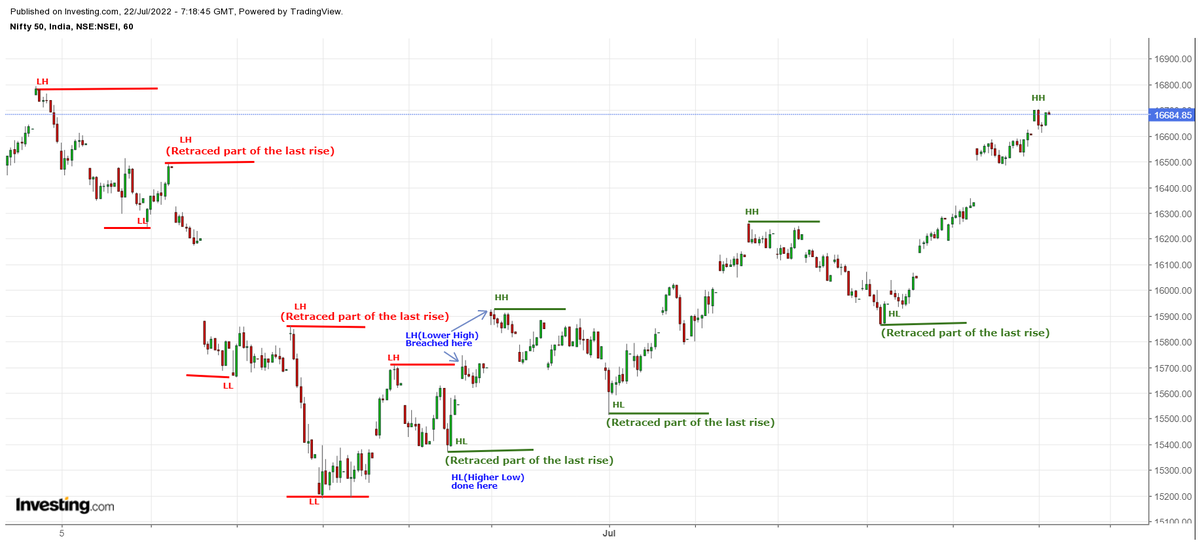
Traders: Use in combo with basic EW knowledge to make entry & exits. When you combine studies of diff. time frames such as Week, Day & Hour, you have potentially a system which will follow prices to good accuracy.
No foolproof system but only more efficient one in relative term.
No foolproof system but only more efficient one in relative term.

Your experience, your discriminating ability to stay off market when picture is unclear with choppy moves, your patience to wait for good opportunities, your intuitive risk taking ability when euphoria & Fear are at their peaks will set you on a path to riches.
Get rich slowly.🙏
Get rich slowly.🙏


Few more charts with #Trendindicator (MACD) of Day t/f
#ICICIBank
#TCS
#ITC
#AxisBank
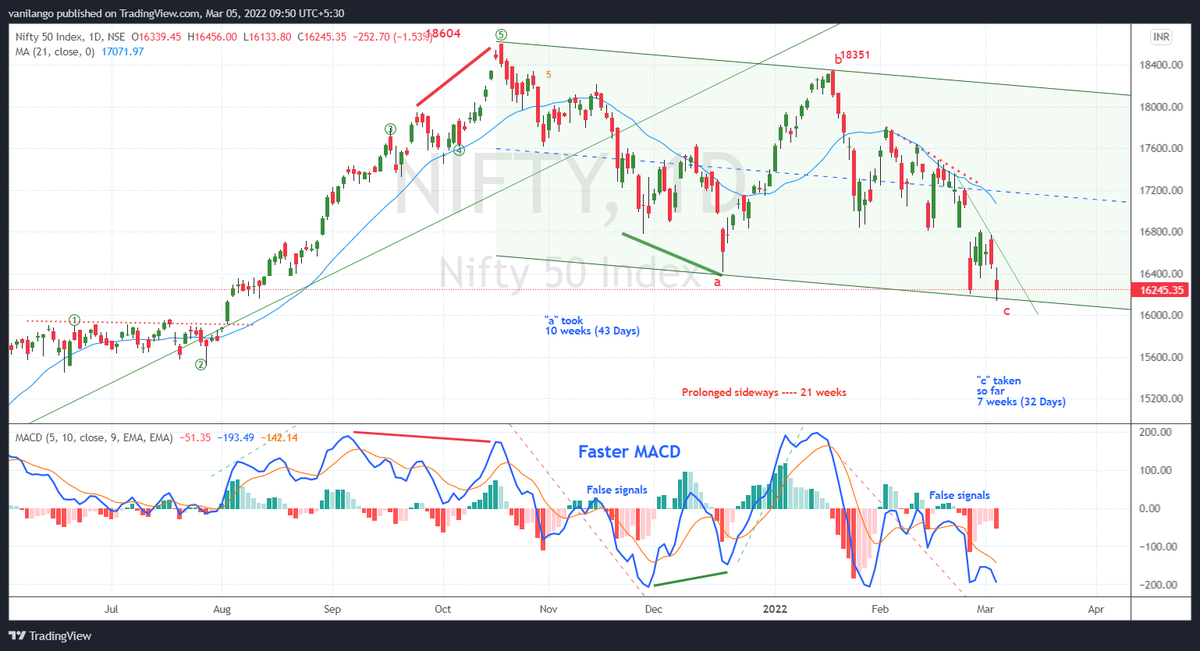
In #Nifty, when week MACD is downtrending, 4 weeks of upmove unfolded fm 16410 to 18351 which could be managed with Day & Hour MACD & once Day & Hour turned Down, it fell to 16134
#ICICIBank
#TCS
#ITC
#AxisBank
In #Nifty, when week MACD is downtrending, 4 weeks of upmove unfolded fm 16410 to 18351 which could be managed with Day & Hour MACD & once Day & Hour turned Down, it fell to 16134


• • •
Missing some Tweet in this thread? You can try to
force a refresh