
🐻♉️↗️↘️↔️⚠️🚩🔺🔻🧮
Global Macro Review 03/27/22
1/8
Nothing but #Quad3 #stagflation
as far as the 👁🗨 can 👀
Commodities ↗️
Yields ↗️
Equities ↗️
Let’s dig into the 🧮!
Global Macro Review 03/27/22
1/8
Nothing but #Quad3 #stagflation
as far as the 👁🗨 can 👀
Commodities ↗️
Yields ↗️
Equities ↗️
Let’s dig into the 🧮!
2/8
The 🔑 to ↘️ prices is ↗️ prices?
Chart: The $CRB closed at a new cycle high 307.33 +5.16% and is now within striking distance of the June 2014 🔝
The 🔑 to ↘️ prices is ↗️ prices?
Chart: The $CRB closed at a new cycle high 307.33 +5.16% and is now within striking distance of the June 2014 🔝

2a/8
Hydrocarbons put in another shift this week 🚀
(w) = week (T) = Trend = 3 months
$BRENT +8.75% (w) +53.05% (T)
$GASO +7.15% (w) +56.35% (T)
$NATGAS + 15.45% (w) +54.55% (T) ⬅️
$WTIC +10.5% (W) +54.35% (T)
Chart: Uncle Joe is going to bottle up Natty and sell it to the EU
Hydrocarbons put in another shift this week 🚀
(w) = week (T) = Trend = 3 months
$BRENT +8.75% (w) +53.05% (T)
$GASO +7.15% (w) +56.35% (T)
$NATGAS + 15.45% (w) +54.55% (T) ⬅️
$WTIC +10.5% (W) +54.35% (T)
Chart: Uncle Joe is going to bottle up Natty and sell it to the EU

2b/8
Grains were also ↗️ on the week
$CORN +1.65% (w) +24.45% (T)
$SOYB +2.55% (w) +27.5% (T)
$SUGAR +3.6% (w) +2.14% (T) 🆕 ♉️
$WHEAT +4.55% (w) +34.1% (T)
Chart: $SUGAR +9.0% over (t) = trade duration = 1 month and now ♉️ Trend
Grains were also ↗️ on the week
$CORN +1.65% (w) +24.45% (T)
$SOYB +2.55% (w) +27.5% (T)
$SUGAR +3.6% (w) +2.14% (T) 🆕 ♉️
$WHEAT +4.55% (w) +34.1% (T)
Chart: $SUGAR +9.0% over (t) = trade duration = 1 month and now ♉️ Trend

2c/8
But not everything is ♉️ in the ag space
I will take my ☕️ black, please
Chart: $COFFEE +0.9% (w), -7.1% (t), -3.95% (T), but is that a 😄 I see?
But not everything is ♉️ in the ag space
I will take my ☕️ black, please
Chart: $COFFEE +0.9% (w), -7.1% (t), -3.95% (T), but is that a 😄 I see?

2d/8
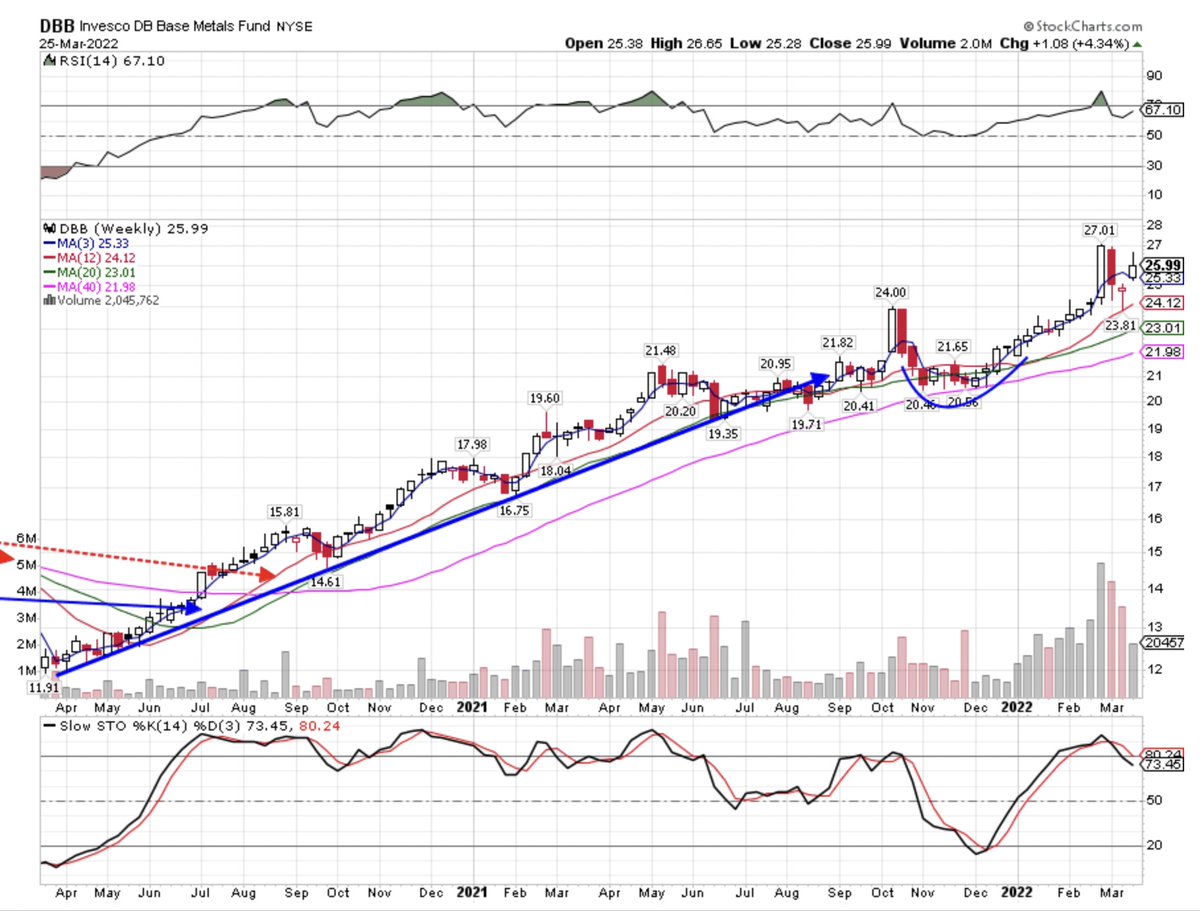
Metals were more of a ↔️ 💼 this week
$PLAT -2.65% (w) +3.45% (T)
$COPPER -0.85% (w) +7.05% (T)
$GOLD +1.3% (w) +7.85% (T)
$SILVER +2.07% (w) +11.65% (T)
Chart: $DBB +5.8% (w) industrial metals remain bid ↗️ +17.25% (T) but on weakening volume
Metals were more of a ↔️ 💼 this week
$PLAT -2.65% (w) +3.45% (T)
$COPPER -0.85% (w) +7.05% (T)
$GOLD +1.3% (w) +7.85% (T)
$SILVER +2.07% (w) +11.65% (T)
Chart: $DBB +5.8% (w) industrial metals remain bid ↗️ +17.25% (T) but on weakening volume
2e/8
And, of course, we have to mention $LUMBER which has broken bad - not surprising given the 🚀 in rates and the effect on housing.
Chart: $LUMBER -17.05% (t), -16.5% (T)
And, of course, we have to mention $LUMBER which has broken bad - not surprising given the 🚀 in rates and the effect on housing.
Chart: $LUMBER -17.05% (t), -16.5% (T)

3/8
10Y treasury yields around 🌍 💥 ↗️
This is not normally indicative of growth slowing… but it could just be the markets doing CBs jobs as investors demand +yield given sticky #inflation
Chart: UST 10Y 2.48% 🇺🇸
10Y treasury yields around 🌍 💥 ↗️
This is not normally indicative of growth slowing… but it could just be the markets doing CBs jobs as investors demand +yield given sticky #inflation
Chart: UST 10Y 2.48% 🇺🇸

3a/8
Chart: DET 10Y .59% 🇩🇪
Chart: DET 10Y .59% 🇩🇪

3b/11
Chart: JPT10Y 0.23% 🇯🇵
Chart: JPT10Y 0.23% 🇯🇵

3c/8
UST volatility remains 🛗
Chart: MOVE 125.27 😱
UST volatility remains 🛗
Chart: MOVE 125.27 😱

3d/8
The belly of the curve is threatening the long-end with #inversion raising the specter 👀 of #recession 12-18 months hence
5Y 2.561% +41.5 BPS this week alone 😮
30Y 2.602% +18.1 BPS
Chart: 30/5s 4.1 BPS dropped 23.5 BPS this week, a massive move ↘️
The belly of the curve is threatening the long-end with #inversion raising the specter 👀 of #recession 12-18 months hence
5Y 2.561% +41.5 BPS this week alone 😮
30Y 2.602% +18.1 BPS
Chart: 30/5s 4.1 BPS dropped 23.5 BPS this week, a massive move ↘️
4/8
Bond ETFs and 60/40 portfolios have been 💥
$TLT -3.6% (w) -13.35% (T)
$IEF -2.75% (w) -8.0% (T)
$LQD -2.1% (w) -10.1% (T)
$HYG -1.45% (w) -6.7% (T)
$BNDD -0.65% (w) - 4.63% (T)
$CWB +0.75% (w) -8.1% (T) ⬅️
Chart: $LQD -4.45% this month alone
Bond ETFs and 60/40 portfolios have been 💥
$TLT -3.6% (w) -13.35% (T)
$IEF -2.75% (w) -8.0% (T)
$LQD -2.1% (w) -10.1% (T)
$HYG -1.45% (w) -6.7% (T)
$BNDD -0.65% (w) - 4.63% (T)
$CWB +0.75% (w) -8.1% (T) ⬅️
Chart: $LQD -4.45% this month alone

5/8
Turning to equities … 🇺🇸
$SPX +1.8% (w) - 3.85% (T)
$COMPQ +2.0% (w) - 9.5% (T)
$IWM +1.4% (w) - 7.15% (T)
… as vol ↘️
$VIX 20.81 -3.06 pts
$VXN 27.34 -0.42 pts
$RVX 26.77 -3.0 pts
Chart: $COMPQ +3.45% (t), but still 🐻 (T)
Turning to equities … 🇺🇸
$SPX +1.8% (w) - 3.85% (T)
$COMPQ +2.0% (w) - 9.5% (T)
$IWM +1.4% (w) - 7.15% (T)
… as vol ↘️
$VIX 20.81 -3.06 pts
$VXN 27.34 -0.42 pts
$RVX 26.77 -3.0 pts
Chart: $COMPQ +3.45% (t), but still 🐻 (T)

5a/8
US Sectors
Alpha generators
$XLE +6.6% (w) + 43.45% (T)
$XLB +3.7% (w) +1.1% (T)
$XLU +2.8% (w) +5.9% (T)
Hurting returns long side
$XLV -0.55% (w) - 2.2% (T)
$XLRE -0.2% (w) - 5.6% (T)
$XLY +0.8% (w) - 9.75% (T)
Chart: $XLU +7.7% (t) is getting you 💰 this month
US Sectors
Alpha generators
$XLE +6.6% (w) + 43.45% (T)
$XLB +3.7% (w) +1.1% (T)
$XLU +2.8% (w) +5.9% (T)
Hurting returns long side
$XLV -0.55% (w) - 2.2% (T)
$XLRE -0.2% (w) - 5.6% (T)
$XLY +0.8% (w) - 9.75% (T)
Chart: $XLU +7.7% (t) is getting you 💰 this month

5b/8
Get some!
Chart: $SPYV +1.3% - large cap value has flipped to ♉️ (t) +2.55% and (T) +1.45%.
Get some!
Chart: $SPYV +1.3% - large cap value has flipped to ♉️ (t) +2.55% and (T) +1.45%.

5c/8
Short some! 🩳
Chart: A #quad4 long, $XHB 🏠 -8.8% (w) -5.35% (t) -6.4% (T) is getting decimated by ↗️ mortgage rates with 30-year fixed at 4.54%
Short some! 🩳
Chart: A #quad4 long, $XHB 🏠 -8.8% (w) -5.35% (t) -6.4% (T) is getting decimated by ↗️ mortgage rates with 30-year fixed at 4.54%

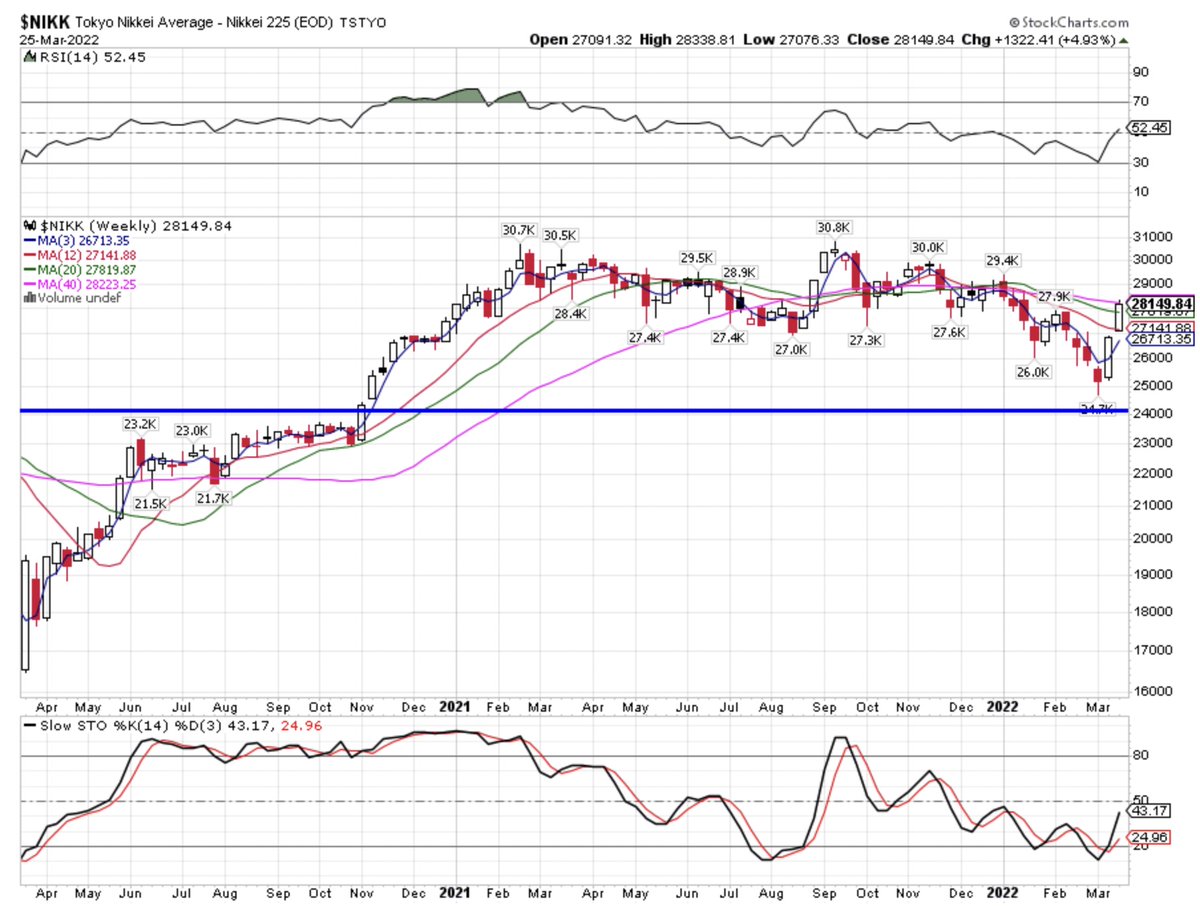
6/8
Internat’l indices more of a ↔️ 💼
$NIKK +4.95% (w) - 2.2% (T)
$KOSPI +0.85% (w) - 8.95% (T)
$HSI -0.05% (w) - 7.7% (T)
$DAX -0.75% (w) - 9.2% (T)
$CAC -1.0% (w) - 7.75% (T)
$SSEC -1.2% (w) - 11.85% (T)
Chart: $NIKK 🇯🇵 - the best performing index over (t) duration +6.32%
Internat’l indices more of a ↔️ 💼
$NIKK +4.95% (w) - 2.2% (T)
$KOSPI +0.85% (w) - 8.95% (T)
$HSI -0.05% (w) - 7.7% (T)
$DAX -0.75% (w) - 9.2% (T)
$CAC -1.0% (w) - 7.75% (T)
$SSEC -1.2% (w) - 11.85% (T)
Chart: $NIKK 🇯🇵 - the best performing index over (t) duration +6.32%
6a/8
Resource rich countries getting you 💰
$EWZ +8.75% (w) +35.8% (T)
$EWA +3.15% (w) +6.0% (T)
$EWC +2.05% (w) +6.95% (T)
$EWW +1.9% (w) +7.75% (T)
Chart: $EWW 🇲🇽 Jarabe Tapatio 💃🏽 +7.0% (t) ♉️
Resource rich countries getting you 💰
$EWZ +8.75% (w) +35.8% (T)
$EWA +3.15% (w) +6.0% (T)
$EWC +2.05% (w) +6.95% (T)
$EWW +1.9% (w) +7.75% (T)
Chart: $EWW 🇲🇽 Jarabe Tapatio 💃🏽 +7.0% (t) ♉️

7/8
In #FX, the 💴 continues to get 🔥
$FXY -2.4% (w) -6.35% (T) 🐻
$FXE -0.65% (w) -3.35% (T)
$FXB +0.02% (w) -1.8% (T)
$FXF +0.15% (w) -1.6% (T)
$UUP +0.6% (w) +2.65% (T)
$FXC +1.0% (w) + 2.65% (T)
$FXA +1.47% (w) +3.68% (T) ♉️
Chart: $FXA +3.97% over (t) duration 🦘🦘♉️
In #FX, the 💴 continues to get 🔥
$FXY -2.4% (w) -6.35% (T) 🐻
$FXE -0.65% (w) -3.35% (T)
$FXB +0.02% (w) -1.8% (T)
$FXF +0.15% (w) -1.6% (T)
$UUP +0.6% (w) +2.65% (T)
$FXC +1.0% (w) + 2.65% (T)
$FXA +1.47% (w) +3.68% (T) ♉️
Chart: $FXA +3.97% over (t) duration 🦘🦘♉️

8/8
Bond market vigilantes doing #CB work, but yields not ↗️ enough to attract 💰 from $SPX or $CRB
Quarterly #opex on 3/31 + ‘month-end markup’ + systematic rebalancing = possible 🌊
Stick with 📈 and have a super profitable 💰 week!
Bond market vigilantes doing #CB work, but yields not ↗️ enough to attract 💰 from $SPX or $CRB
Quarterly #opex on 3/31 + ‘month-end markup’ + systematic rebalancing = possible 🌊
Stick with 📈 and have a super profitable 💰 week!
• • •
Missing some Tweet in this thread? You can try to
force a refresh


