1/21
Why do we have inflation?
Why is it persistent?
And why the Fed has no choice but to address this problem?
And if it means hiking and hiking risking lower asset prices and/or a recession, so be it. Not dealing with inflation would be worse
A thread to explain.
Why do we have inflation?
Why is it persistent?
And why the Fed has no choice but to address this problem?
And if it means hiking and hiking risking lower asset prices and/or a recession, so be it. Not dealing with inflation would be worse
A thread to explain.
2/21
The pandemic was arguably the most important economic event of our lifetime.
It sped up the trend of remote work/work-from-home by at least a decade.
The result is what is now known as the “Great Resignation.”
The pandemic was arguably the most important economic event of our lifetime.
It sped up the trend of remote work/work-from-home by at least a decade.
The result is what is now known as the “Great Resignation.”
3/21
Simply put, the number of people working in an office is still well below pre-pandemic levels.
We have our doubts the percentages in the charts below will return to 100% anytime soon, if ever.
Simply put, the number of people working in an office is still well below pre-pandemic levels.
We have our doubts the percentages in the charts below will return to 100% anytime soon, if ever.


4/21
Instead of asking when these two million people are going to return to the office, maybe we should be asking how many more will be leaving the workforce.
Instead of asking when these two million people are going to return to the office, maybe we should be asking how many more will be leaving the workforce.

5/21
The U.S. currently has 11.26 million open jobs (orange) and 6.27 million unemployed (blue).
So the U.S. has 4.99 million more open jobs than unemployed (middle panel).
Should we be asking if they are out of the workforce because they do not want to return?
The U.S. currently has 11.26 million open jobs (orange) and 6.27 million unemployed (blue).
So the U.S. has 4.99 million more open jobs than unemployed (middle panel).
Should we be asking if they are out of the workforce because they do not want to return?

6/21
So much of economy is structured around 150M+ ppl commuting to a place of work 8 hours a day, 5 days a week.
The pandemic forced a profound change.
Consequently, our consumption basket, the things we buy and consume, has changed to reflect more time away from the office.
So much of economy is structured around 150M+ ppl commuting to a place of work 8 hours a day, 5 days a week.
The pandemic forced a profound change.
Consequently, our consumption basket, the things we buy and consume, has changed to reflect more time away from the office.
7/21
For instance, our consumption of durable goods (things that are expected to last at least three years) has exploded higher. And despite constant calls that this trend will peak with the end of the pandemic, it is not happening, nor do we expect it to happen.
For instance, our consumption of durable goods (things that are expected to last at least three years) has exploded higher. And despite constant calls that this trend will peak with the end of the pandemic, it is not happening, nor do we expect it to happen.
8/21
More work from home means more demand for durable goods.
It is possible the demand for these goods will remain above the pre-pandemic trend (gray line).
And the supply chain will stay overwhelmed until it changes to reflect this reality.
More work from home means more demand for durable goods.
It is possible the demand for these goods will remain above the pre-pandemic trend (gray line).
And the supply chain will stay overwhelmed until it changes to reflect this reality.

9/21
But instead of recognizing this change and capitalizing on this new consumption basket, corporate America is being counseled by Wall Street to do nothing and just wait for the return of 2019 work patterns and consumption habits.
bloomberg.com/news/articles/…
But instead of recognizing this change and capitalizing on this new consumption basket, corporate America is being counseled by Wall Street to do nothing and just wait for the return of 2019 work patterns and consumption habits.
bloomberg.com/news/articles/…
10/21
“When we look back in 5 or 10 years, I don’t think this is an event that is fundamentally going to change the way that we as social creatures live and operate,” [Goldman Sachs CEO David] Solomon said.
—-
Wall Street is banking on this, but id it actually going to happen?
“When we look back in 5 or 10 years, I don’t think this is an event that is fundamentally going to change the way that we as social creatures live and operate,” [Goldman Sachs CEO David] Solomon said.
—-
Wall Street is banking on this, but id it actually going to happen?
11/21
Until we understand this change and start restructuring for a new reality, friction of an “out of balance” economy will keep inflation “persistently elevated.
Until we understand this change and start restructuring for a new reality, friction of an “out of balance” economy will keep inflation “persistently elevated.
12/21
So far it has been two years and we are still arguing if changes consumption happening rather than plotting changes production to meet different demands.
Once started, this process will take years to adjust. Then persistent inflation can subside.
So far it has been two years and we are still arguing if changes consumption happening rather than plotting changes production to meet different demands.
Once started, this process will take years to adjust. Then persistent inflation can subside.
13/21
How Does Monetary Policy Fix This?
Many say the Fed cannot print more oil or print more container ships. This is a reference to the supply shortages that are beyond the control of monetary policy.
How Does Monetary Policy Fix This?
Many say the Fed cannot print more oil or print more container ships. This is a reference to the supply shortages that are beyond the control of monetary policy.
14/21
This argument is not new. It was essentially the same argument made by Fed chair Arthur Burns in the 1970s. Back then the supply constraint was an Arab oil embargo contributing to inflation.
This argument is not new. It was essentially the same argument made by Fed chair Arthur Burns in the 1970s. Back then the supply constraint was an Arab oil embargo contributing to inflation.
15/21
Burns was so convinced this was outside the control of monetary policy that he led the Fed’s effort to create the core inflation measures, or inflation less food and energy.
This was to prove inflation was under control, by excluding the items constrained by supply.
Burns was so convinced this was outside the control of monetary policy that he led the Fed’s effort to create the core inflation measures, or inflation less food and energy.
This was to prove inflation was under control, by excluding the items constrained by supply.
16/21
Today we are doing the same thing, by excluding “reopening components” from inflation, such as airline tickets and used cars.
History is repeating, with he same consequences, persistent inflation that Wall Street refuses to believe.
Today we are doing the same thing, by excluding “reopening components” from inflation, such as airline tickets and used cars.
History is repeating, with he same consequences, persistent inflation that Wall Street refuses to believe.
17/21
Former Morgan chief economist Stephen S. Roach worked at the Fed during this period and detailed Burns’s arguments, which sounded eerily similar to arguments promoted today.
project-syndicate.org/commentary/fed…
Former Morgan chief economist Stephen S. Roach worked at the Fed during this period and detailed Burns’s arguments, which sounded eerily similar to arguments promoted today.
project-syndicate.org/commentary/fed…
18/21
Excess demand due to monetary and fiscal stimulus is a big part of the current inflation surge.
This can be seen in the graphic below from the IMF’s October 2021 Fiscal Monitor.
It shows the U.S. primed the pump far more than any other economy.
Excess demand due to monetary and fiscal stimulus is a big part of the current inflation surge.
This can be seen in the graphic below from the IMF’s October 2021 Fiscal Monitor.
It shows the U.S. primed the pump far more than any other economy.

19/21
And, not surprisingly, the U.S. is in the rare position of having the highest inflation rate in the developed world.
The black line in the top panel shows the US core inflation rate.
The bottom panel shows it is the highest in the developed world.
And, not surprisingly, the U.S. is in the rare position of having the highest inflation rate in the developed world.
The black line in the top panel shows the US core inflation rate.
The bottom panel shows it is the highest in the developed world.

20/21
Simply put, the Fed stimulated its economy far more than any other developed country. This contributed to the U.S. having the highest inflation rate in the developed world.
Simply put, the Fed stimulated its economy far more than any other developed country. This contributed to the U.S. having the highest inflation rate in the developed world.
21/21
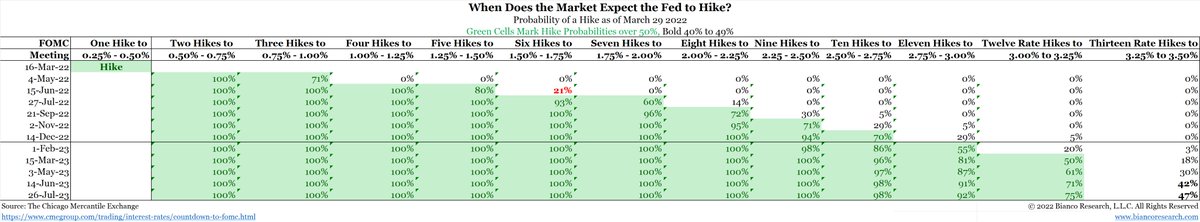
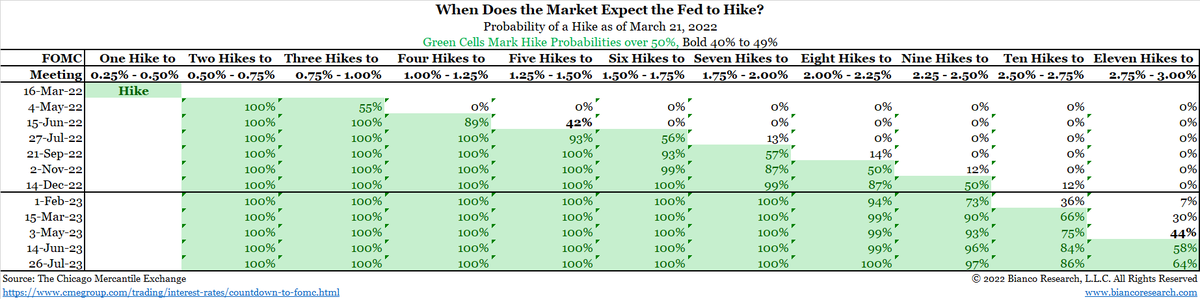
The Fed can work to remove the inflation due to the excess demand from the stimulus.
68% of 50 in May
71% 50 in Jun
36% of 50 in Jul
Almost 10 hikes this year
The changes to consumption baskets are a trickier issue. Inflation will be persistent until this changes.
The Fed can work to remove the inflation due to the excess demand from the stimulus.
68% of 50 in May
71% 50 in Jun
36% of 50 in Jul
Almost 10 hikes this year
The changes to consumption baskets are a trickier issue. Inflation will be persistent until this changes.

• • •
Missing some Tweet in this thread? You can try to
force a refresh