U.S. quarterly stocks won't be the main event Thursday, but supplies are tighter than usual so they can't be forgotten. Trade estimates would be: #Corn: +2.4% YOY, -5.7% on 5yr avg #Soybeans: +22% YOY, -8.5% on 5yr avg #Wheat: -20% YOY, -30% on 5yr avg, 13yr low for date
Don't be fooled by +22% YOY for #soybeans when it comes to Sept. 1 possibilities. 2nd half use in 20/21 was a 6yr low and 18% below the 5yr avg. Exports were extremely light for the period after the big effort in H1, and the remaining 21/22 book is much bigger than usual.
When I say quarterly stocks aren't the main event, what I mean is that U.S. corn and soy acreage in particular will be the two numbers the market wants to see first on Thursday. But never dismiss stocks.... they can stir up chaos anytime, anywhere.
To follow up on this, if 1.902 bbu is the true March 1 supply of #soybeans, and if 2nd half 21/22 U.S. soy use matches 2019's record, that puts ending stocks at 84 mbu.
Striking out poll low outlier, trade avg is 1.914 bbu, putting Sep 1 at 96 mbu with use = record.
Maybe use won't be record, but should be pretty high. So in order to avoid very thin 21/22 soy ending stocks, we either need to find more soybeans (was the crop bigger?), some exports likely would need to be rolled/cancelled/no more sales, crushers need to ease up a little.
USDA c/o estimate is 285 mbu. If March 1 is 1.902 bbu, that implies H2 use 1.6% above the recent 5yr avg, but 11% below record and below the same periods in 2018, 2019, 2020.
Does that usage target sound reasonable? Why or why not?
• • •
Missing some Tweet in this thread? You can try to
force a refresh
The world grew a record wheat crop in 2021/22, but don’t let that deceive you when it comes to actual availability.
You must look at the projected year-end stocks and most critically, the expected demand relative to those stocks, also record high.
Global #wheat stocks-to-use in 2021/22 of 28.5% would be a six-year low. Excluding #China, that ratio falls to 16.6%, a 14-year low.
But most of the actual available global supplies lie in the major exporters. Stocks-to-use in those countries of 14% is close to all-time lows.
Why do we exclude #China? It will hold 51% of the world’s #wheat by mid-year. None of that wheat is available to the global market as it is stockpiled for food security.
Five straight bumper crops will allow #India’s exports to hit records this year. It too has gov't reserves.
Lot's of discussion yesterday on the surprisingly light U.S. acreage intentions. This is total 2021 acres versus March 2020 intentions (I posted these numbers versus 2020 final yesterday). Most states reported fewer planted acres for 2021 than they did for 2020.
But I asked farmers yesterday to give insight on why acres were light and got a BUNCH of good answers (thank you!). Some of those explanations (high cost of inputs, prices of other crops - hay for example, rotations, etc) all make sense. Check out that thread if you haven't.
Another possible angle: If we claim low confidence in USDA's 2021 numbers, wouldn't we also want to question their March 2020 numbers? Maybe the March 2020 intentions were too ambitious. And ultimately, these numbers are based on what farmers told USDA.
March 1 #corn stocks come in slightly below expectations while those for #soybeans just a bit above. #Wheat stocks came in higher than the trade guess.
Versus what was reported in January, December 1 stocks came in:
#Corn 28 million bushels lighter #Soybeans 13 mln bu heavier #Wheat 29 mln bu heavier
No change to Sept. 1 stocks! 🥳
Just a quick table to show how these Dec. 1 revisions compare with prior years. Lighter on corn than last year but heavier than usual on both soy and wheat.
#China agreeing to make $50 billion in U.S. agricultural purchases in 2020.
The RECORD value for annual U.S. ag product exports to China was in 2012 at just under $26 billion. Compare commodity prices then and now. For reference, 2017 was $19.5 billion.
And if you consider Ag & Related Products (includes fish & forestry products) - max was $29 billion in 2013. So this is the absolute max previous ceiling considering all exports that could be considered ag.
I'm not seeing how $50B is possible in 2020.
I posted this as a reply below, but worth repeating:
The max annual combined export value of U.S. #pork and #soybeans to ALL destinations: $31 billion in 2012.
Add in #corn (TOTAL, to ALL buyers): $41 billion in 2014.
Only 67% of U.S. #corn was planted as of June 2, well below the five-year average of 96%. That is +9 points on the week and below the trade guess of 71%.
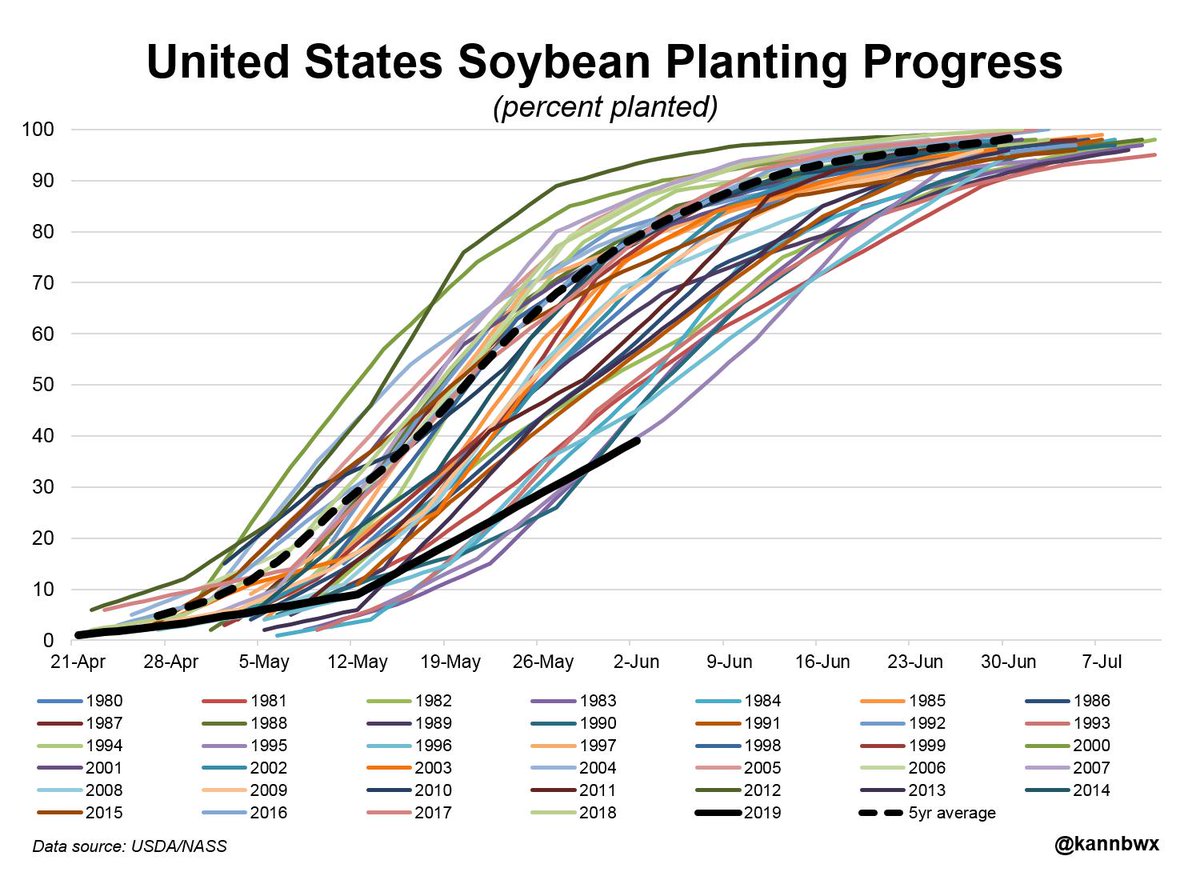
The planting pace has been RECORD slow for 2.5 weeks now. #plant19
U.S. #soybeans were 39% planted as of June 2, now the SLOWEST on record and well below the average of 79%. That is +10 points on the week. The trade was expecting progress at 42%. #plant19
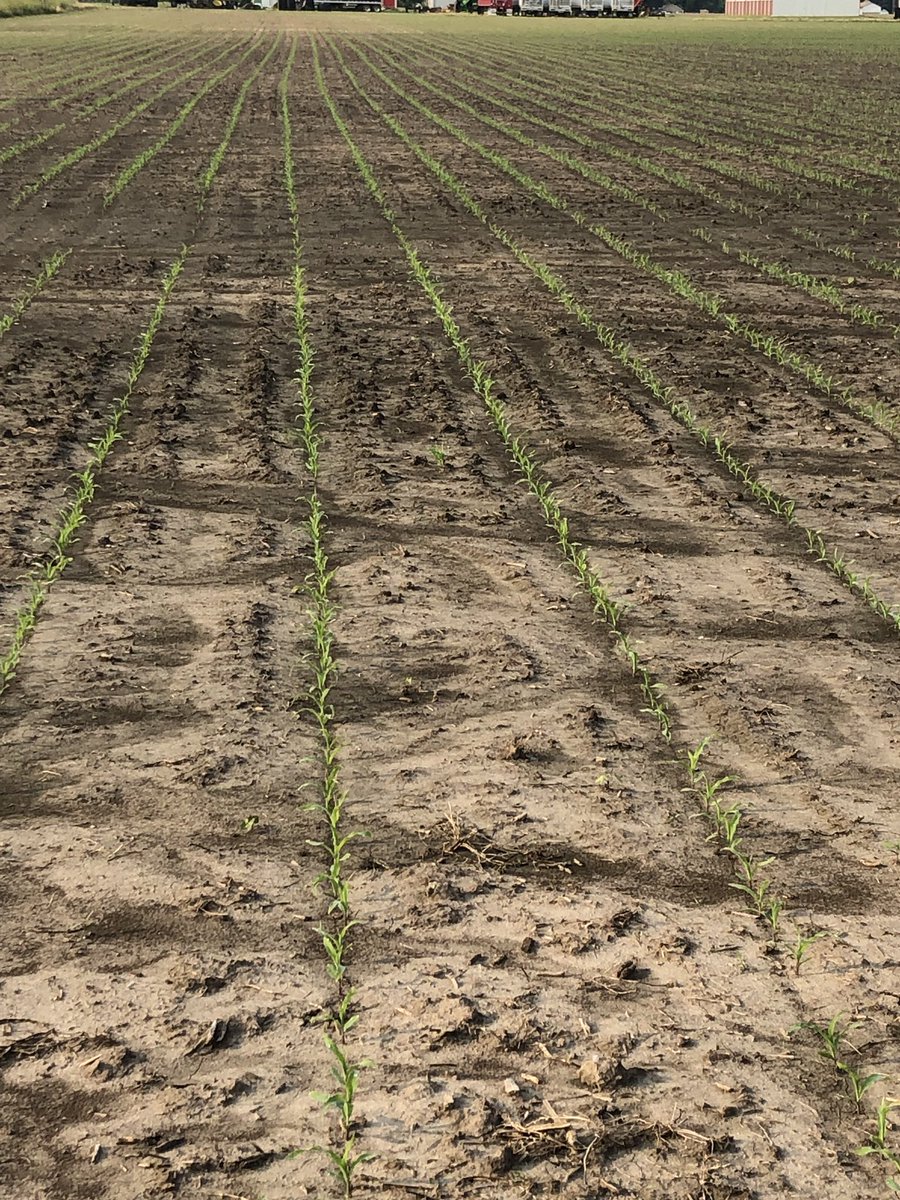
A view of the #CropWatch19#corn field in southern Illinois. Half of the 90 acres needs replanting but it is far too wet to attempt that now. And more rain may be coming early next week. Planted May 18.
Here's the end rows on the higher ground. #Corn in this part of the field is looking average at best right now.
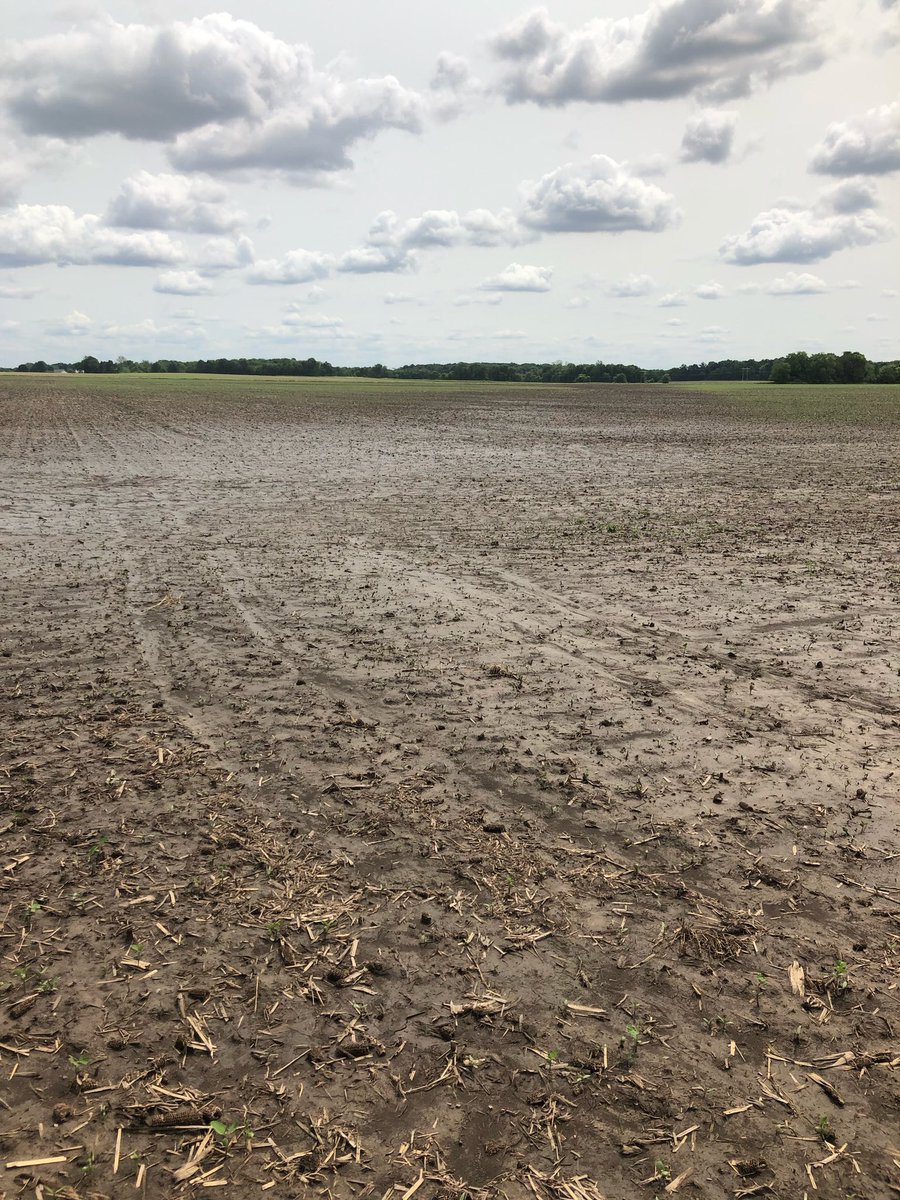
The #CropWatch19#soybeans in southern Illinois, right next to the corn, are in better shape than the corn but at least 10 acres of the 90 need replanting - if it ever dries up.