Alastair Thompson Profile picture
Apr 17, 2022 40 tweets 19 min read Read on X
North Africa, Ethiopia and Middle East long range rainfall forecast bulletin:

The interaction between the two greatest Equatorial forests is having a massive impact on weather (see quoted thread for more).
This bulletin begins with a look at Ethiopia where rains over the #HornOfAfrica have been steadily building in April (img: today). A strong big rainy season is indicated by this, notwithstanding a strong La Nina which is typically associated with droughts (see quoted thread ^^).
We can see a glimpse of the GERD today - Easter Sunday in the Western Church - through the clouds (Rosieres Top Right - GERD Bottom Left). Satellite images of the dam - which this year will have its 2nd filling - may be increasingly hard to get with increasing cloud.
This image from April 13tt shows the GERD and Rosieres (Dam) as well as Lake Tana, the pride of Gondar and source of the Abbay aka the Blue Nile which provides roughly 60% of the flow of the mighty Nile river.
Last year the 2nd GERD filling was completed on July 19th-21st. Just three weeks into the big rainy season - as a result of high levels of rain. The year before, 2020, the 1st filling was completed on July 20th. God willing there will be another early filling this year.
These 10 & 12 day accumulated rain forecast maps for rain in the #HornOfAfrica are from yesterday. They show rain in #Ethiopia (incl Tigray, Afar and Somali regions) as well as #Eritrea #Somalia and #Sudan. The first two are from the KMA model (10 & 12 days).
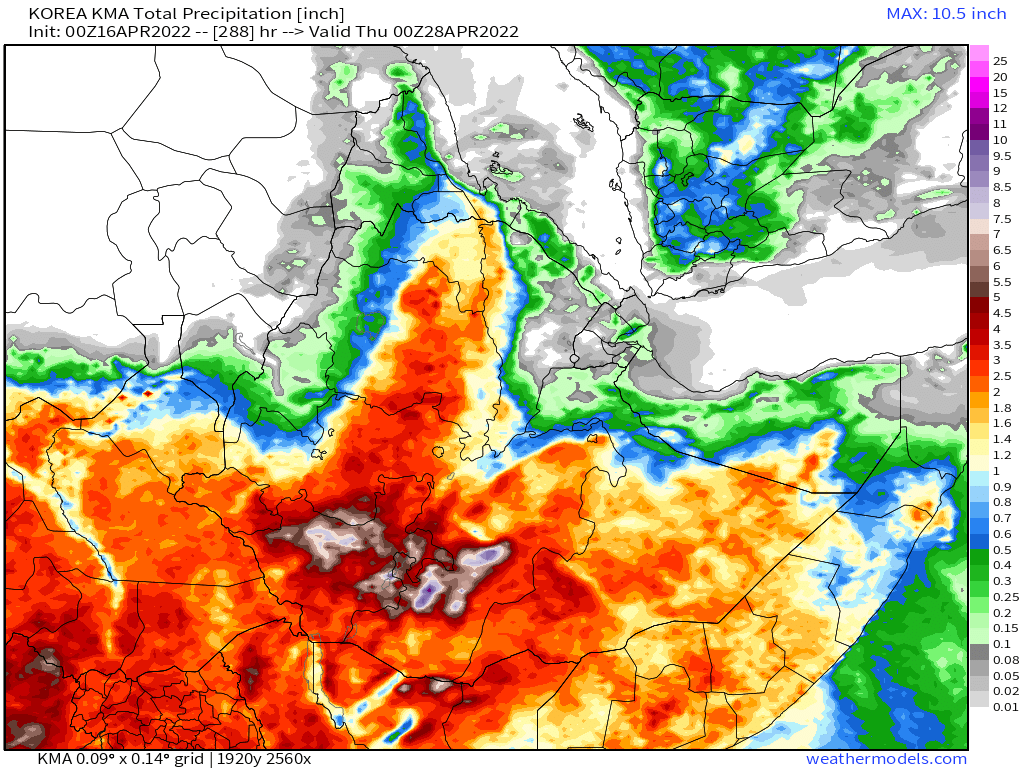
These three plots, from today, show estimated total rain over the next three days. The forecast rain is remarkably widespread. Rain will likely be particularly welcome in the dryer and drought effected areas in the East of the Horn - Somalia and Ethiopia's Somali region.
This animation - also from yesterday shows the atmospheric weather picture over Ethiopia over 10 days - ECM model - there are multiple sources of the water which will bring this rain - which I will discuss later in this bulletin.
^^ There is a significant regional (ME+HOA "flooding of the zone" PWAT (Precipitable Water) event beginning April 19th-20th, driven by convection in the Indian Ocean which is responsible for much of this rain. The red areas you see in the animation show a glimpse of this.
We will now move to the Middle East.

The regional "flooding the zone" event is already underway - and is forecast to intensify this coming week. This animation shows storms in Saudi Arabia yesterday.
This animation begins on the 13th and ends on 14th of April.
. @Arab_Storms remains the best source of eyewitness reports of the consequences of storms on the Arabian Peninsula. Here are a few of his recent tweets.
But what is really extraordinary is what is yet to come in the Middle East, especially when you bear in mind that model rainfall forecasts for the Arabian Peninsula tend to under-estimate the intensity of rains.
Here are four 10 day model forecasts for rainfall in the Mddle East (yesterday's runs)
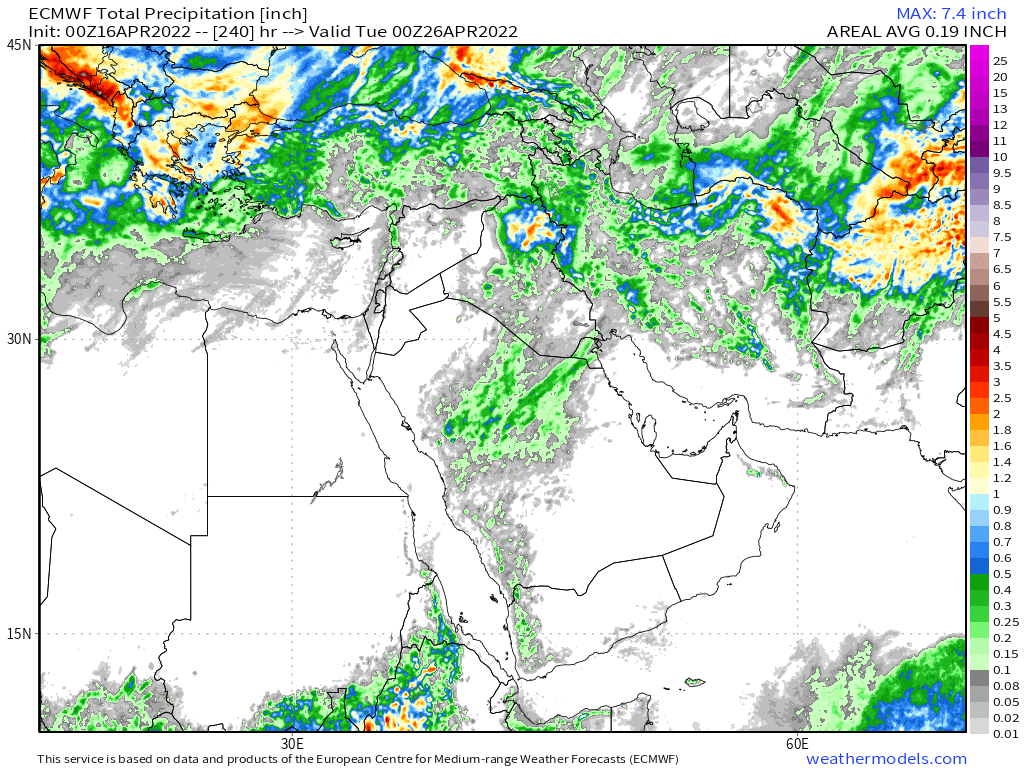
These three day forecasts cover the period before the significant rains arrive.
This animation shows the broader picture. Rain falling on the mountains in the South West of the peninsula today are higher than forecast - and they are being fed from the North, by a Saharan water transport event - which is indicative of what we are seeing more generally.
This PWAT (Precipitable Water) animation 16-days shows the "Flooding the zone" ME rain event through to early May.
These are yesterday's long range rainfall forecasts - 12, 15 and 16 day accumulated rain forecasts for the region. In the 12 months I have been following this - I have never seen anything remotely like this.
While April is Saudi Arabia's wettest month. Historically that typically means 1-5 days of rain - in most places the average is closer to 1. This forecast shows rain every day over Saudi Arabia - over large areas of desert.
Next up we are going to look at North Africa - beginning with an PWAT animation of all of Africa. In this animation you can see (at the beginning) a cyclonic event over Madagascar (another one) which is contributing to this.
This animation shows PWAT anomlay over the entire African continent. And what is startling in this is the consistent anomaly over the Sahel - which has been there for weeks now.
This animation shows the source of the water stream which is bringing rain to in Jinzan Mountains today in West Africa.
The WMA (West African Monsoon) is one of two sources of water causing the current and forecast sources of water over the Middle East. The other is the Amazon.
This animation from the 11th-12th April shows the interaction of the two monsoons more clearly. There is a flow of water westerly from the WMA into the Amazon. And just north of it a return path, carrying water from the Northern Amazon over Western Sahara.
This animation is from tonight. It shows a new atmospheric river, not yet that intense, originating in the north of the Amazon.
This closeup animation - 24 hours shows the source of this atmospheric river more clearly.
A16 day animation shows how this atmospheric river is expected to evolve and intensify. A messy picture as the dominant water flow is to the west, but the direction of the red "lip" we see here definitely indicates a North Easterly atmospheric river strengthening.
This broader view shows simplifies the picture -as within the atmospheric column water can flow in different directions in large quantities. Intense convection projects water into jet streams which carry water massive distances at high speed. And in this case over the Sahara.
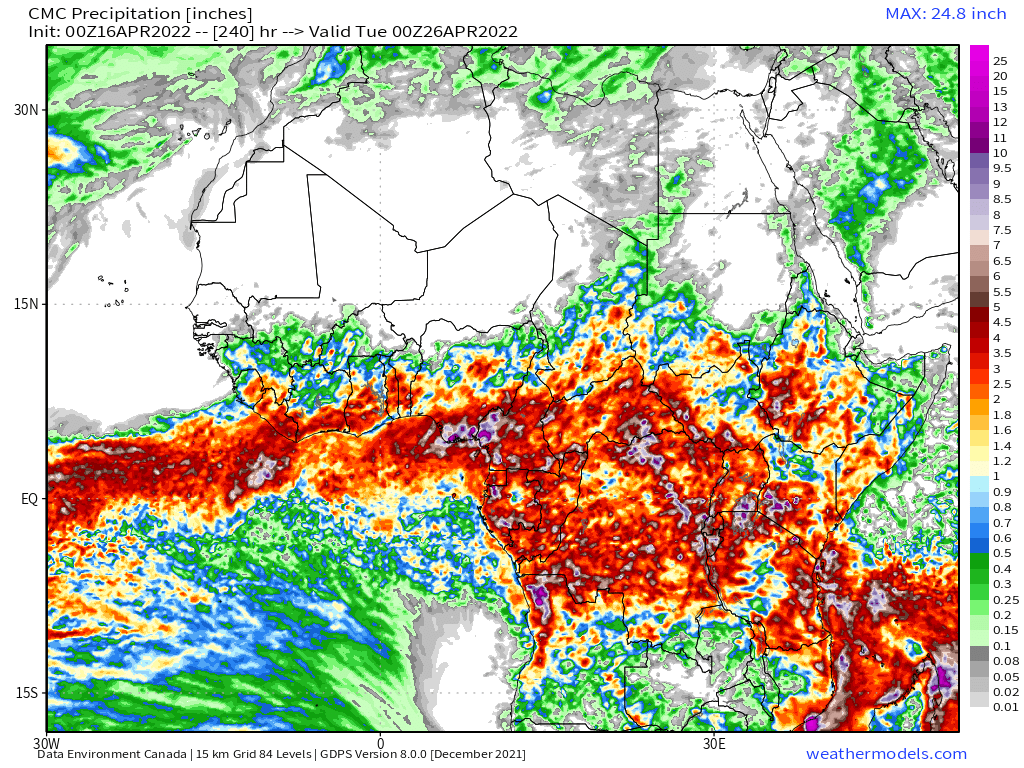
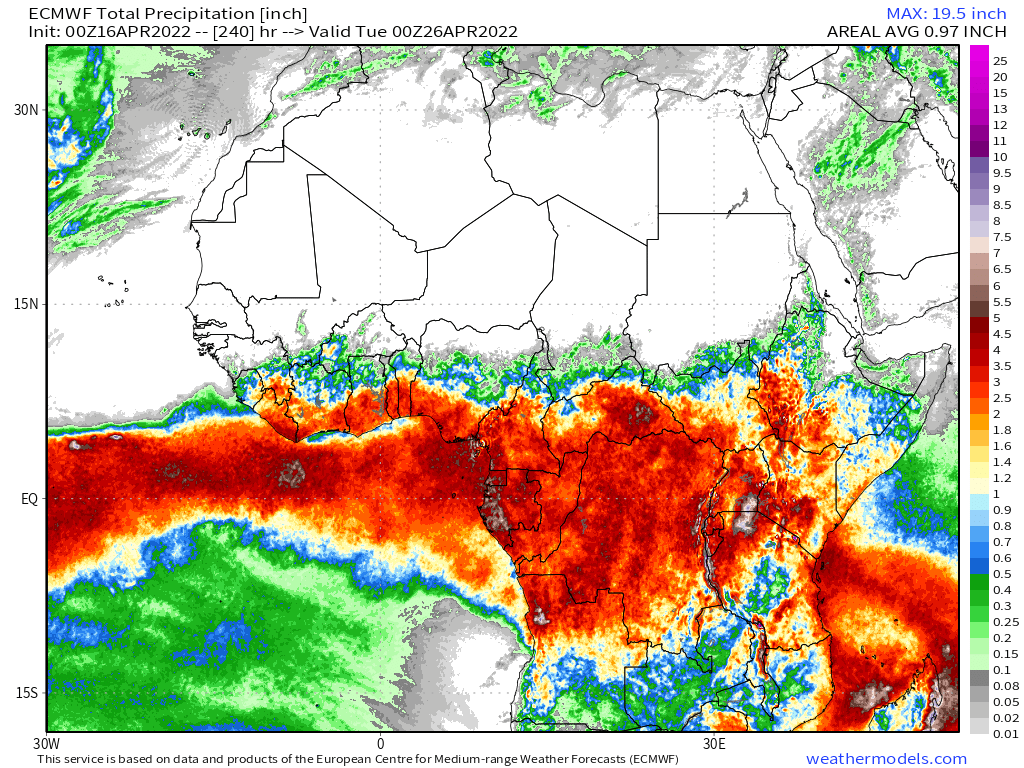
This animation is from the Canadian CMC model and it illustrates the "flooding the zone" hypothesis very clearly. The amount of atmospheric water we see here over Sudan and Chad, is seriously anomalous for this time of year.
Which brings us to the consequences in rainfall. The CMC model is an outlier here. But all models even the conservative ECMWF are showing a very intense WMA for this time of year - and significant rains across the #Sahel & in the #HOA and #MiddleEast.
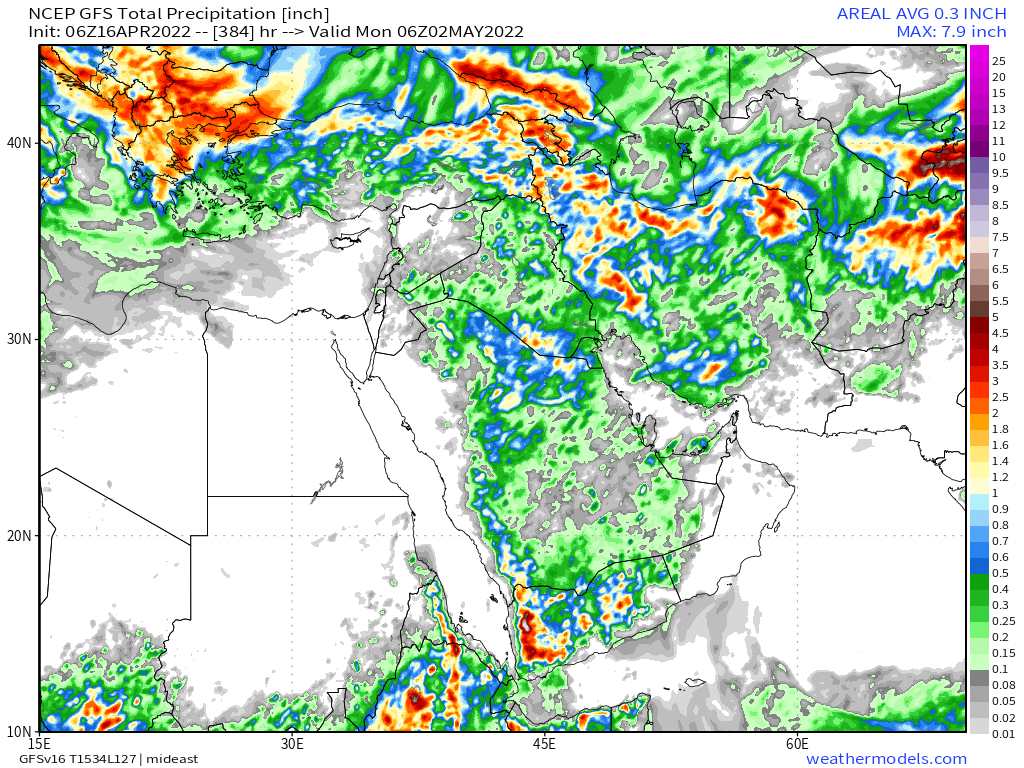
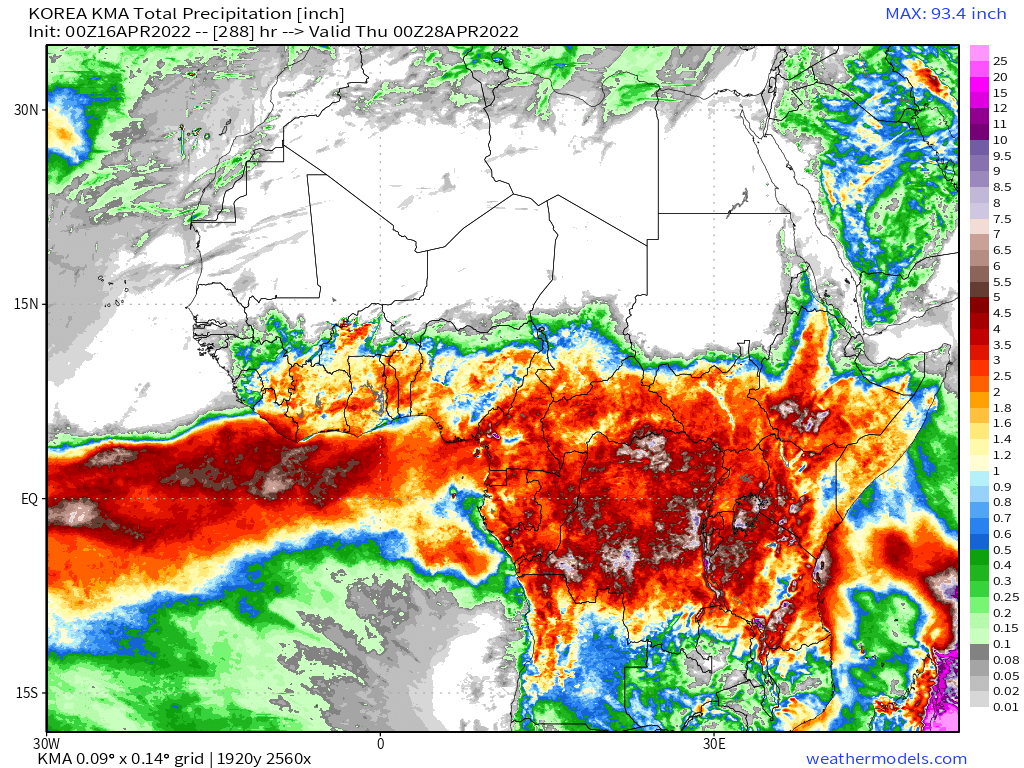
Here we have longer range forecasts, respectively 12 (KMA), 16 (GFS) and 15 (EPS) days.
Finally because its interesting, its important to understand that the Europe is also affected by all this. This from today shows the impact of the West African Monsoon sourced atmospheric river over the Eastern Mediterranean.
Over the next 16 days Europe's Zone is also expected to be flooded.
BONUS images:

Rainfall forecasts for:
1. All of Africa
2. North Indian Ocean and SEA
3. Eurasia
4. Europe.
/ENDS

@Threadreaderapp unroll

• • •

Missing some Tweet in this thread? You can try to force a refresh
 

Keep Current with Alastair Thompson

Alastair Thompson Profile picture

Stay in touch and get notified when new unrolls are available from this author!

Read all threads

This Thread may be Removed Anytime!

PDF

Twitter may remove this content at anytime! Save it as PDF for later use!

Try unrolling a thread yourself!

how to unroll video
  1. Follow @ThreadReaderApp to mention us!

  2. From a Twitter thread mention us with a keyword "unroll"
@threadreaderapp unroll

Practice here first or read more on our help page!

More from @althecat

Jul 21
THREAD: Some thoughts on October 7th and the importance of their being global transparency over what we know about what really happened on that terrible day.

1/ This (see screenshots in the first few posts in this thread) is one of the most important pieces of conflict related journalism published in recent years.

It relates to the orders given to soldiers on October 7th to fire on any vehicle seeking to return to the Gaza Strip to prevent the taking of hostages and was published on July 7th, 10 months later in Haaretz.Image
2/ As @IsraeliPM Benjamin Netanyahu prepares to address congress it is vital that the public in the US, Israel and globally is fully aware of what exactly happened on October 7th in Gaza. Image
3/ The account in this story published by Haaretz is at this time still behind a paywall and it has therefore not been read by the very large number of people who ought to have done so. I have not seen very many reports containing the detail of this report elsewhere though I presume there are many.

A copy of the report can be found however on here >> Archive.is
archive.md/zqUntImage
Read 16 tweets
Jul 8
OK so clearly #HurricaneBeryl is not the same as #HurricaneHarvey. But there are some striking similarities in terms of what has made it so much more persistent than either forecast or as modeled.

This thread is going to look at this issue a bit more deeply.
- The overall cloud mass of the #HurricaneBeryl thunderstorm complex proved much more resilient than expected once it came over land. Why?
- Also Like #Harvey Beryl did slow down after making landfall and continued to spin over land. Why?
- I think the answer to both questions relates to the very warm waters of the Gulf of Mexico. Like Harvey back in 2017, Beryl has been fueled by a constant stream of warm wet atmospheric flows of energy off of the Gulf of Mexico.
- This is obvious in part simply from observing the astonishing expansion of the cloud field after #Beryl made landfall early this morning.

A clue to understanding this can be found in looking at the the astonishing growth progression of #HurricaneBeryl's cloud field over landafter Beryl strengthened and formed itself into a Hurricane in the period after making landfall south of Houston.

Over the course of the rest of the morning you can see in these images how much the wind field expanded.
Like Harvey #Beryl also grew and strengthened itself by feeding off of the gulf of mexico, specifically the area between the Texas coastline and what looks like the outer boundary of the convection field which expanded extremely strongly to the north.

The only source for all this additional atmospheric moisture can be the oceanic convection which took place in what is a fairly clearly bounded 136,000 km2 area of ocean which as you can see in this animation is very closely bound to the rest of the circulation.

This is a much much larger area than the area of active rainfall which settled over the city and metropolis of Houston for the morning and which is finally starting to move off to the north now.
This version of the graphic shows the comparative sizes of the area of water which is responsible for the astonitising growth of post landfall #HurricaneBeryl - and the area of the storm that remained over the ocean and which is almost certainly responsible for both why this storm was so persistent and why it (like Harvey) slowed down after coming ashore.
Read 4 tweets
Jul 8
#HurricaneBerylis not expected to give up lightly as it moves onshore and turns north eastward over Texas and then heads north east across the great planes towards the great lakes.

Typically we expect hurricanes to weaken rapidly over land - especially wind wise. But #Berylis not forecast to behave as normal - probably because like Harvey, its tail over the Gulf is keeping it fueled. - the currently forecast pattern from Fox News's exclusive model shown in these images was present in some of the simulations of Beryl after it crossed the Yucutan a couple of days ago.

To my mind questions ought to be asked about the accuracy of the forecasting for this storm, as - like the last super destructive Texas Hurricane, Harvey in 2017 [] Beryl is proving to be a LOT more destructive in its impacts than initially forecast.en.wikipedia.org/wiki/Hurricane…Image
Image
Image
Image
The final image in this sequence of screenshots of Fox Weather Graphics is worth drawing attention to as it shows how much broader the impacts of this hurricane are expected to be as it moves across the great planes roughly speaking heading up the Mississippi river, and continuing to dump potential flooding rain as it goes.Image
This image shows the forecast expected severe weather threat from the remnants of #HurricaneBeryl in Arkansas and Missouri up as far as Saint Louis. Image
Read 6 tweets
Jul 8
ALERT: High Target News Environment in play - numerous consequential news events with global implications.

1. British elections - (Thursday July 4th-Friday July 5th): Delivering an unprecedented landslide win to the left's @UKLabour Party + strong showings for the Liberals and Greens . The UK Chancellor @RachelReevesMP will shortly set out her economic policy in a speech.

2. French elections (Sunday July 7th) deliver a remarkable 2nd big win for the left in politics in France - dashing the hopes of Marine le Pen's hard right wing "Rassemblement National" of first parliamentary victory

3. Overnight (7th-8th July): an unprecedented huge Hurricane , #Hurricane Beryl - makes landfall in Houston as a Category 1 Hurricane, its main threat to the epicenter of the global fossil fuel industry will be flooding. It is still night in Houston at present.
You can watch the new UK Chancellor's speech live here now >> youtube.com/live/oJUvTVdTM…
English language coverage of the French Election from @France24_en can be watched here >>
Read 5 tweets
Jul 1
Hmmmmmm…. Why is the audio of the @youtube version of the UNSG office daily briefing for 1st July missing sound from 5:24 to 6:07?

Afghanistan, Lebanon, Myanmar & other topics - Daily Press Briefing (1 J... via @YouTube

Image
Image
The content of this portion is available as it is simply a quote from written remarks of UNSG @antonioguterres made to a meeting in Austria. But the missing YouTube audio is unprecedented in my experience and hard to explain.
Video from the un platform is here. webtv.un.org/en/asset/k12/k…
Read 10 tweets
Jun 23
Another day. Another Israeli
war crime.

Intense bombing by Israeli forces on Gaza continues and kills at least 3... via @YouTube
This report also addresses the widening rift between Israeli PM Netanyahu and the U.S. Government. True to form Netanyahu is showing no sign of backing down. But this tweet showing former Defence Minister Yoav Gallant leaving on a U.S. flight for the U.S. speaks volumes in this very intense moment.

Amidst continued bombing of Rafah, Israeli forces are resuming strikes i... via @YouTube
And here from two days ago more Margaret Brennan context on the rupture in relations between the @WhiteHouse and @IsraeliPM

Israel has not come close to destroying Hamas, U.S. official says via @YouTube
Read 7 tweets

Did Thread Reader help you today?

Support us! We are indie developers!


This site is made by just two indie developers on a laptop doing marketing, support and development! Read more about the story.

Become a Premium Member ($3/month or $30/year) and get exclusive features!

Become Premium

Don't want to be a Premium member but still want to support us?

Make a small donation by buying us coffee ($5) or help with server cost ($10)

Donate via Paypal

Or Donate anonymously using crypto!

Ethereum

0xfe58350B80634f60Fa6Dc149a72b4DFbc17D341E copy

Bitcoin

3ATGMxNzCUFzxpMCHL5sWSt4DVtS8UqXpi copy

Thank you for your support!

Follow Us!

:(