🇺🇸USA, 🇧🇷#Brazil, 🇦🇷#Argentina & 🇺🇦#Ukraine account for 85% of the world's corn exports. But who ships where?
🇺🇸Let's start in top exporter USA. China, Mexico & Japan were the destinations for 69% of all shipments last year.
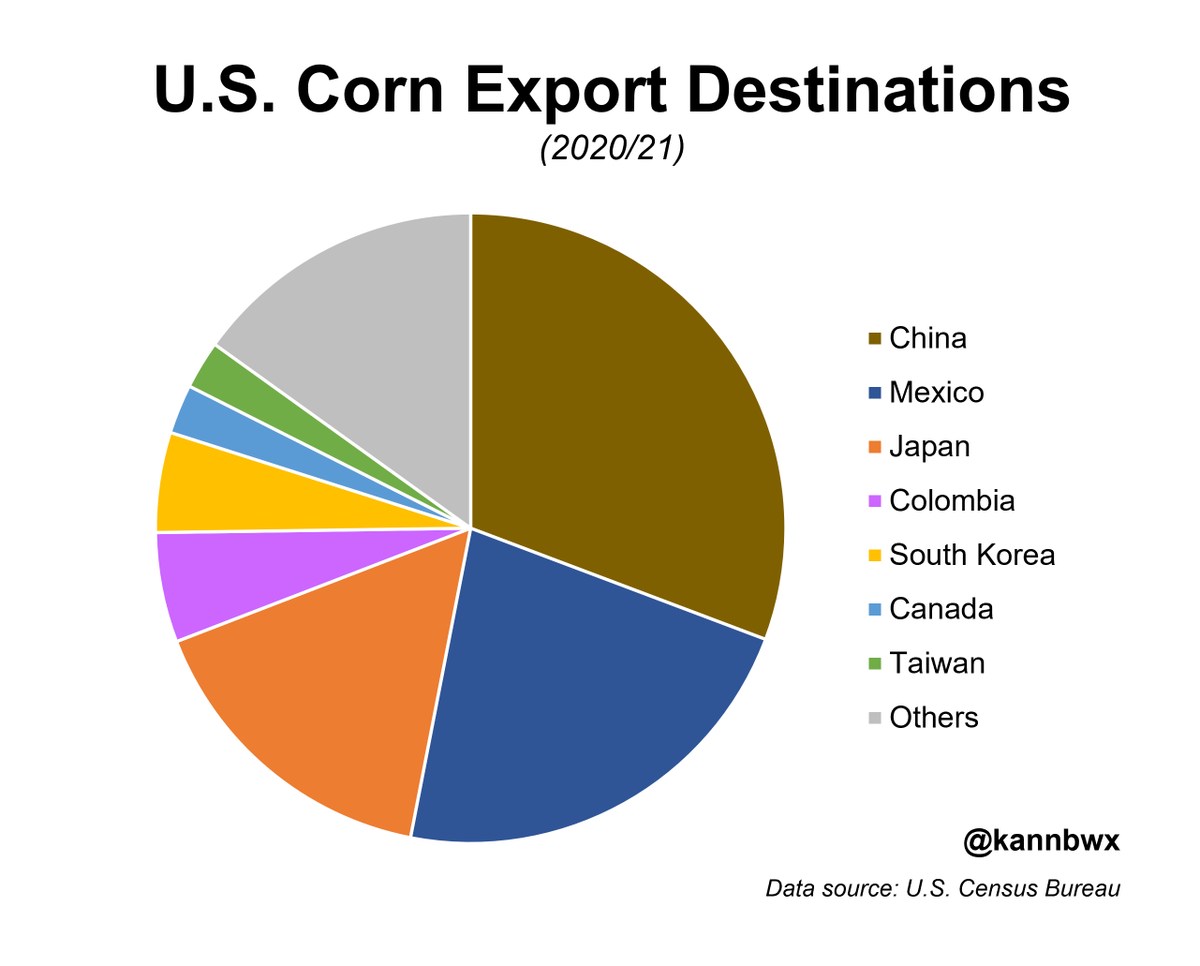
🇺🇸USA only started shipping heavily to #China again in the last two years, so here is the 3-year average prior to that. Mexico, Japan & South Korea accounted for 58%.
🇧🇷Two-thirds of shipments out of No. 2 #corn exporter #Brazil end up in these seven countries: Iran, Japan, Egypt, Vietnam, Spain, South Korea & Taiwan. That has been true the past 3 years despite annual export volumes varying drastically based on the harvest outcomes.
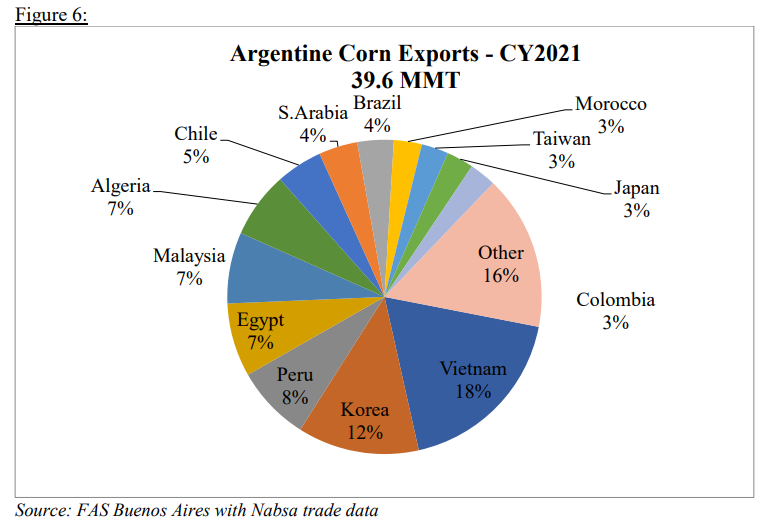
🇦🇷Moving on to No. 3 #Argentina. This chart from USDA shows Vietnam & South Korea as the top two destinations for Argy #corn last year, accounting for 30% of exports. North African nations accounted for at least 17%, same for other South American countries.
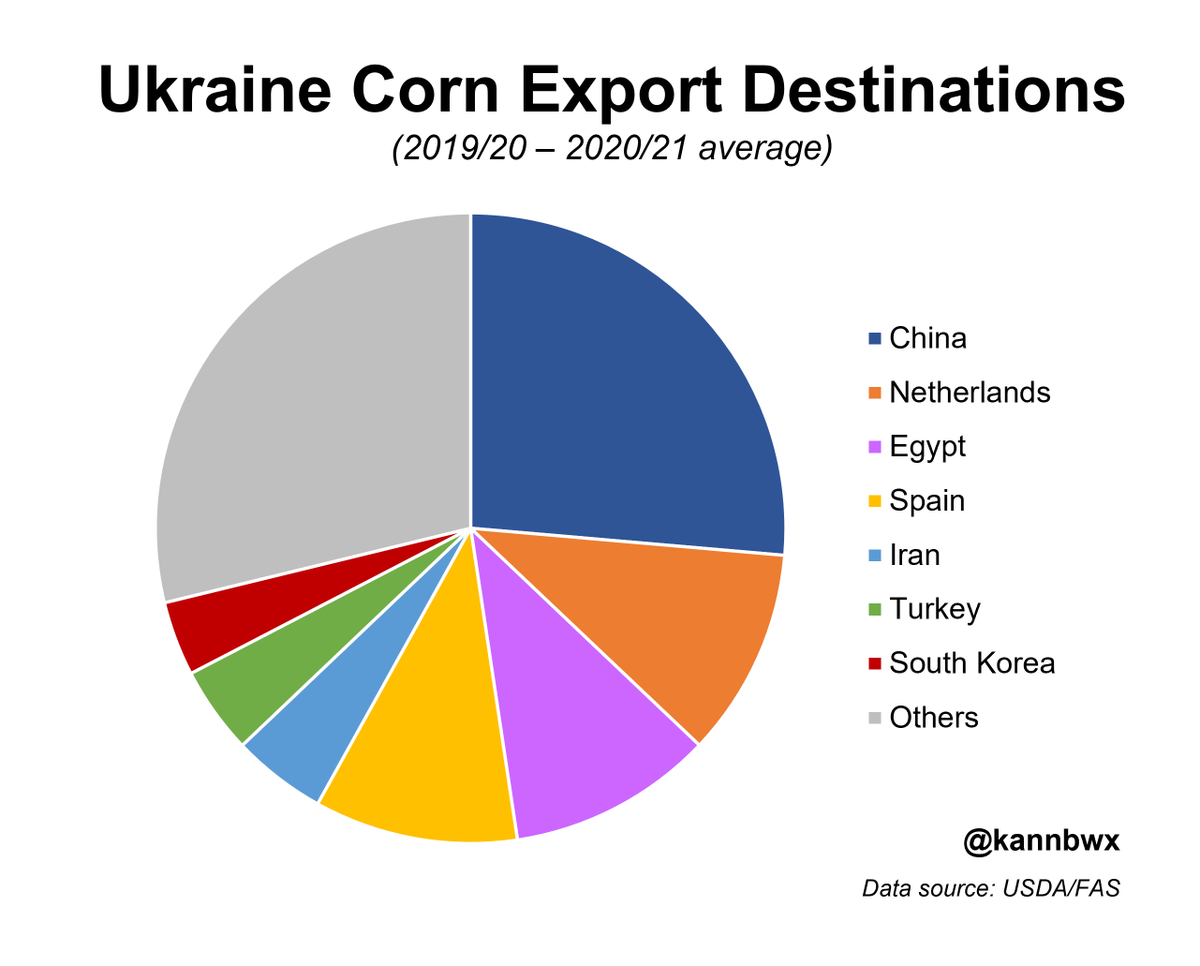
🇺🇦Finally, #Ukraine. Forward export potential is unknown due to the ongoing war, but China has been the leading buyer of its #corn in the last two years. 21% of Ukraine's exports enter Europe via Netherlands or Spain, and Ukraine & Brazil share top customers in Egypt & Iran.
Some key observations to make: China is not among Brazil or Argentina destinations. Also make note of Brazil's top customers and who else supplies them in case dry weather damages its crop. Ukraine would have a tough time making up for any of that, though, at least for now.
• • •
Missing some Tweet in this thread? You can try to
force a refresh
🌽It's hard to tell 2023 (so far) apart from 2012 or 2013 on a new-crop #corn chart. Nearly identical.
But 2012 and 2013 are about to break up in a BIG way, and U.S. weather was the catalyst. Where 2023 heads depends on (much needed) Midwest rains in the coming weeks.
Look at the 6-10 and 8-14 day U.S. weather outlooks from June 5, 2012 & 2023. Prices softened into June 2012 because weather outlooks weren't disastrous (yet). I'm not saying AT ALL (seriously) that 2012 is our eventual outcome, but I highly value reviews of past thinking.
Can't leave out fund positioning when comparing years. They weren't bearish #corn in 2013 until July, but they weren't too bullish in June 2012 or 2013. Bit of a different story now, but funds covered shorts at the end of May, potentially carrying through early June?
Harvested area for U.S. #soybeans fell toward the low end of the trade range. The overall 580k drop was driven by mid-south & eastern states, along with a 900k acre combined reduction across IL-IA-SD. Planted acres = 87.5M (was 88 in Aug).
Trade's been wanting higher soy acres since the low side shocker in June. IMO, we might be placing too much emphasis on FSA data or are drawing incorrect conclusions from it. The way the data is collected has changed in recent years, so "completeness" analyses prob aren't useful.
In analysts' defense, here's their planting guesses for #soybeans vs USDA actual this year:
March poll: 88.7M
March 31 actual: 91M
June poll: 90.4M
June 30 actual: 88.3M
Sept actual: 87.5M
That March survey REALLY threw the ideas off for much of this year...
🇺🇸A brief history of U.S. #corn yield growth since the 1860s 🌽 Notable growth in yields was seen after the adoption of modern fertilizers in the 1940s, which made drought years esp. in the 1980s stand out more than before (compare with 1930s Dust Bowl for example).
I didn't include all possible difference makers on the chart, just the top ones, but there are probably other things I could include. Anyone have suggestions?
This shows just how bad the 1988 & 2012 droughts were (you can also see 1983, 1993, etc in there).
The first chart makes trend yield look like it's just up up up. But let's zoom in. Look at the last several years. What's really the trend? To me, 181 for 2022 seemed too high (USDA's original "unofficial" before planting delays). Input greatly welcome here, it's been on my mind.
U.S. spring #wheat planting was near record slow as of Sunday at 73% complete, as wet weather has delayed top growers North Dakota & Minnesota. Spring wheat accounts for 32% of the full U.S. wheat crop, and last year's spring harvest was the smallest since 1988 due to drought.
North Dakota grows about half of the U.S. spring #wheat, but Minnesota, accounting for 14% of production, is planting at the slowest pace ever. Almost no wheat got planted in the state until last week. Still, it is uncertain just how many of MN's intended acres will get planted.
Only 29% of U.S. winter #wheat was in good/excellent health as of Sunday, the lowest for the week since 2006. Other years with similarly low ratings had terrible yields. However, the winter wheat problems have been known for some time now. Wasn't much room for spring crop errors.
North Dakota is planting #corn & #soybeans at a record slow pace, corn by a comfortable margin. Only 56% of ND's corn was planted by May 29, and May 25 was the last day for most ND farmers to plant 🌽 and be fully eligible for elected crop insurance. ND grows 3% of U.S. corn.
North Dakota grows 5% of U.S. #soybeans, a large portion of which get exported to China. Only 23% of ND's beans were planted by May 29 vs 86% last year. Final crop insurance planting date is June 10, but to complete planting, ND cannot have any more rainy episodes from here.
North Dakota's spring #wheat planting is no longer slowest ever (but it's close) at 59% complete by May 29. Final planting date is either May 31 or June 5, but 91% of ND's wheat should be planted by now. ND grows half of the country's protein-rich spring wheat.
USDA will allow U.S. farmers to plant on acres currently parts of the federal conservation program with no penalty in order to ease global food supply worries. The offer is open to farmers in the final year of their contract with USDA's CRP program.
I've discussed this before on here. Given that June is in less than a week, I believe farmers would have needed significantly more notice in order to make anything happen this year. Don't forget, planting crops is incredibly expensive this year.
Just one year ago (when grain prices were already at multi-year spring highs), USDA was attempting to add more acres to CRP in both the short and long term for climate mitigation purposes. That announcement is here: fsa.usda.gov/news-room/news…