
Gap fill on $GDXJ & $SILJ last week, but no such luck with $GDX. Stopped dead at the gap now may be rolling over. (Upside, GDX held lows while GDXJ & SILJ broke them & recovered)
There are a few things concerning me here with miners that seem a bit reminiscent of last summer/
There are a few things concerning me here with miners that seem a bit reminiscent of last summer/


$Euro has been a perfect example recently of something I've illustrated before in articles. Bull markets, RSI>40, MACD above 0. Bear markets RSI<60 MACD<0. Euro has been declining for a whole yr now. RSI never printed above 60, MACD has stayed below 0 line the whole time/

Notice $GDX chart. Decline phases red, incline green. Inclines=corrections to near MAs, then resume higher RSI> 40, MACD>0. Declines=price peaks just above MAs, RSI<60, MACD<0 line.
Price rolling over testing orange MA w/ RSI ~52 & MACD<0. Feeling like summer 2021 again/
Price rolling over testing orange MA w/ RSI ~52 & MACD<0. Feeling like summer 2021 again/

We can see a similar pattern in $GDXJ & $SILJ as well. Every great short (or put buying/ investment portfolio protection opportunity) in miners last summer came with RSI peaking at 50-60 coupled with price poking its head above the orange MA before getting whacked once again./


The exception here would be if we saw a similar pattern to March 2021. A rally fails w/ RSI ~60, then a retest of lows, or higher low w/ RSI holding at 40, then finding buyers again.
If we see something like that, odds become much better that we've got a solid low in place./
If we see something like that, odds become much better that we've got a solid low in place./

The upside is sentiment is bad & COT reports show large specs bailing to lowest long positions in #gold & #silver in 2yrs. These would be bullish indicators IF in a bull market, but spec longs always decline in bear markets & bad sentiment gets worse. So again, which 1 are we?/


I'm leaning more heavily to this looking bearish. Plunges like we just saw almost never casually resume uptrends. At the very least, a retest the lows is likely. #Gold ~1850 looks decent vs miners at these levels, but that was the case last summer too & miners kept dropping/
While I wouldn't be buying producers here, I don't see the risk/reward benefit to buying downside protection on them either. (But many thought the same 2013 & thing got worse). Building on your JR investment positions after huge drops is never a bad idea though, if you have cash/
Key is cash, which is why I said when things got moving in Feb, remember those bags you've been holding & don't make the same mistake. Take profits on moves higher, don't be scared of missing out, because the big declines ALWAYS come with little warning/
https://twitter.com/Jmergz1985/status/1496857600801275906
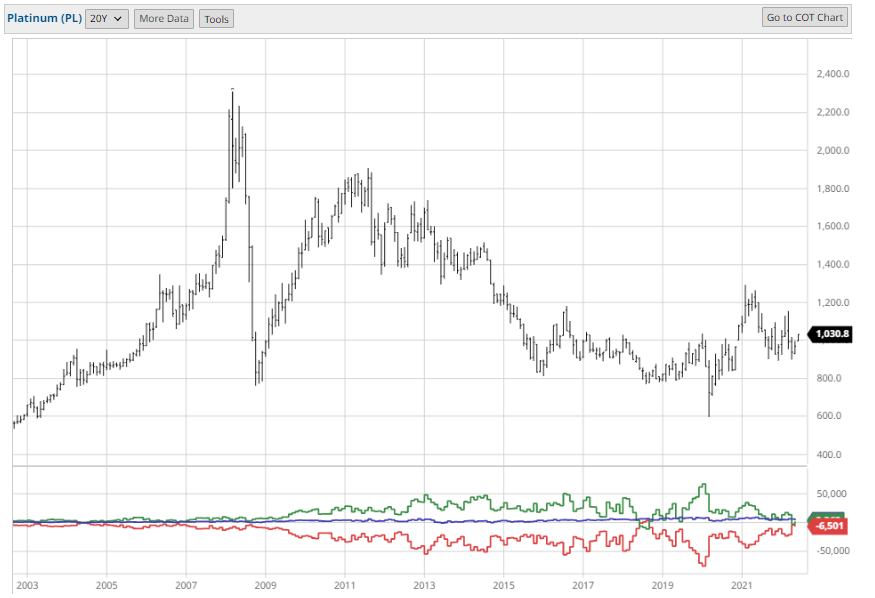
*Side note, #Platinum Large specs are currently ~0. Last time they were this low in Fall 2018, platinum was 800 on its way to gain 25% in 1.5 yrs & #Palladium large specs are net short the same amount they were at the end of last yr, right before palladium doubled./

Everyone assumes Fed pivots to support economy eventually, but if problem w/economy is inflation, they are stuck seeing this through till they kill it. May be some tough times in all markets ahead. CPI Fri, FOMC next week, should have better sense of ST direction by then. *end.
• • •
Missing some Tweet in this thread? You can try to
force a refresh


