
#Gold #Silver #Commodities #Cycles #MarketTiming
I've studied every major price swing in gold & I have observed that [among other mkt conditions]:
▪️ gold follows cycles that expand/contract geometrically
▪️ the 1869 panic has played a key role
▪️ price & time are interchangeable
I've studied every major price swing in gold & I have observed that [among other mkt conditions]:
▪️ gold follows cycles that expand/contract geometrically
▪️ the 1869 panic has played a key role
▪️ price & time are interchangeable
In this thread, we will discuss the last concept. Often, a significant PRICE (low, high, price range) will repeat in the future in the form of TIME (days, weeks, months) at a major turning point (vice versa). This not TA. It is a lost art.
The charts show the spot market, but the prices & dates are based on the December continuous futures contract. For illustrative purposes, the 1869 gold panic has also been 'shown' in the charts. Selected examples are presented below.
𝐂𝐡𝐚𝐫𝐭 #1 - 𝐆𝐨𝐥𝐝 𝐦𝐮𝐥𝐭𝐢𝐲𝐞𝐚𝐫 𝐦𝐨𝐧𝐭𝐡𝐥𝐲 𝐜𝐡𝐚𝐫𝐭
The red vertical lines show the price range between certain major turning points. Functions of these price cycles keep repeating.
The red vertical lines show the price range between certain major turning points. Functions of these price cycles keep repeating.

𝐂𝐡𝐚𝐫𝐭 #2 - 𝐓𝐡𝐞 2008 𝐇𝐢𝐠𝐡
Unbelievable price & time symmetry 28 years after the 1980 major high! The high was 1909 (~1907) weeks from the 1971 low. This time cycle (1907) showed up a few times, a sign that it would show up as a key price point (see the 2011 high).
Unbelievable price & time symmetry 28 years after the 1980 major high! The high was 1909 (~1907) weeks from the 1971 low. This time cycle (1907) showed up a few times, a sign that it would show up as a key price point (see the 2011 high).

𝐂𝐡𝐚𝐫𝐭 #3 - 𝐓𝐡𝐞 2008 𝐋𝐨𝐰
Gold squared precisely the 2006 high (price became time). 144 is a key WD Gann number. The time cycle of '1047' showed up a few times, a sign that we should be alert for it to show up in price. The MAJOR low in gold (2015) came exactly at $1047!
Gold squared precisely the 2006 high (price became time). 144 is a key WD Gann number. The time cycle of '1047' showed up a few times, a sign that we should be alert for it to show up in price. The MAJOR low in gold (2015) came exactly at $1047!

𝐂𝐡𝐚𝐫𝐭 #4 - 𝐓𝐡𝐞 2015 𝐋𝐨𝐰
Price range (1971-2011) = $1872
Time (1980 - 2015) = 1872 weeks!
Time (2008-2011) = 1047 days
Low (2015) = $1047!
Price range (2006 -2012 high*) = $1047
*start of the 5-yr bear mkt
** 860 to show up...
Price range (1971-2011) = $1872
Time (1980 - 2015) = 1872 weeks!
Time (2008-2011) = 1047 days
Low (2015) = $1047!
Price range (2006 -2012 high*) = $1047
*start of the 5-yr bear mkt
** 860 to show up...

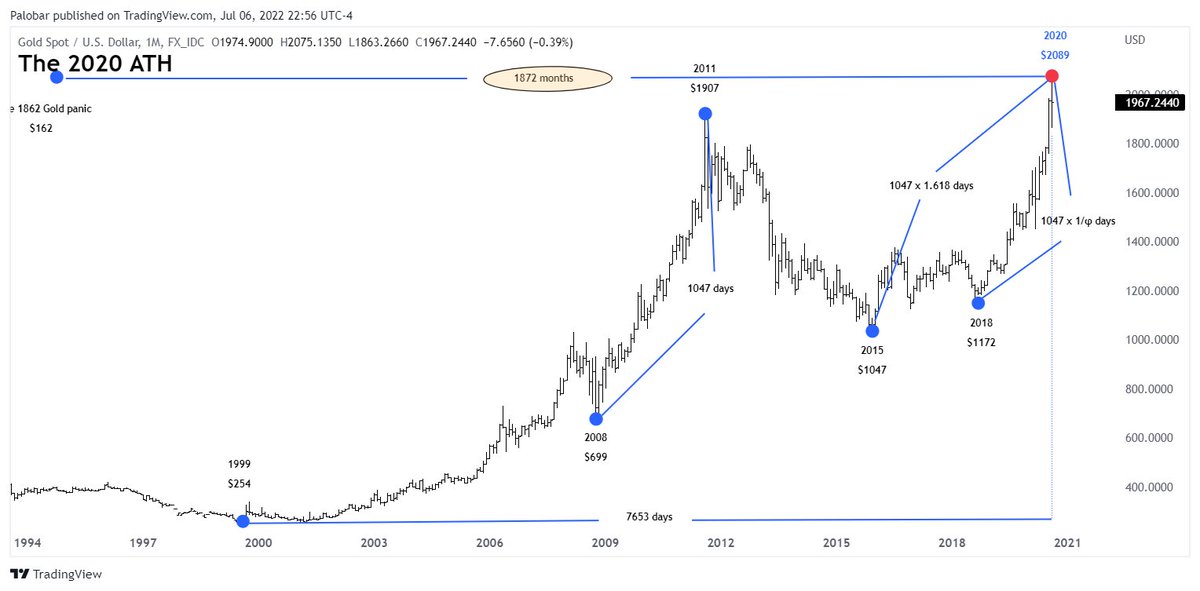
𝐂𝐡𝐚𝐫𝐭 #5 - 𝐓𝐡𝐞 2020 𝐀𝐓𝐇
Price range (1971-2011 ATH) = $1872
Time (1869 - 2020 ATH) 1872 months!
Time (1999 low - 2020 ATH) = 7653 days*
*a deviation of only 13 days (not months ~8YCL)
** I called this top 8 months in advance (13d off)
Price range (1971-2011 ATH) = $1872
Time (1869 - 2020 ATH) 1872 months!
Time (1999 low - 2020 ATH) = 7653 days*
*a deviation of only 13 days (not months ~8YCL)
** I called this top 8 months in advance (13d off)
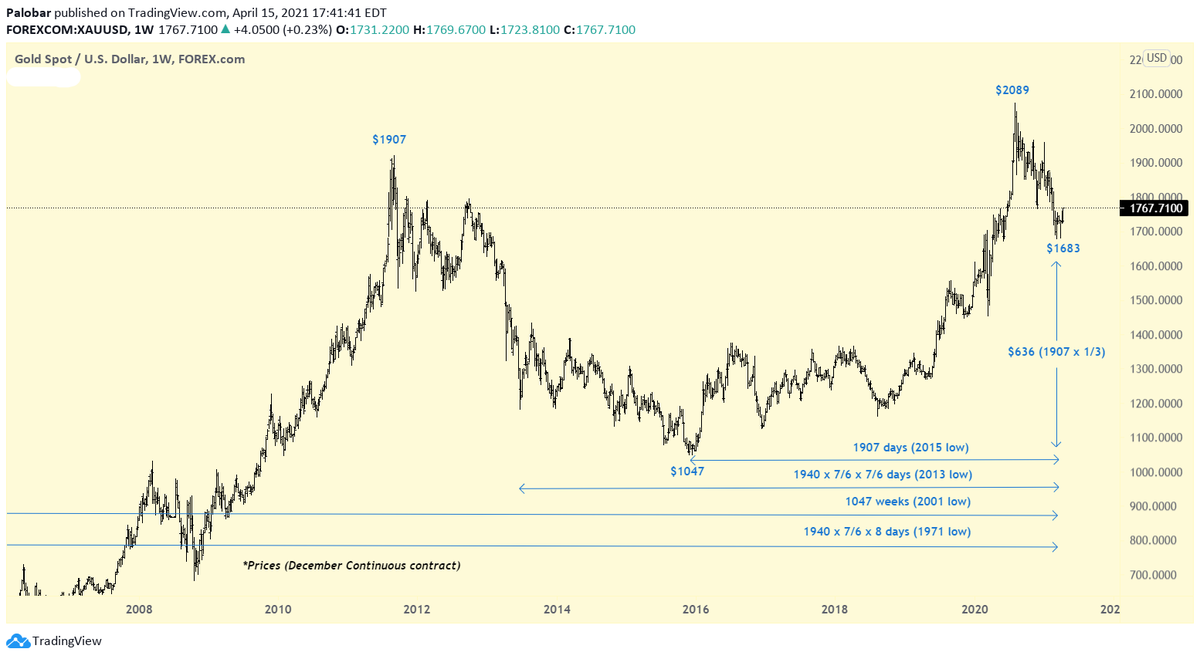
𝐂𝐡𝐚𝐫𝐭 #6 - 𝐓𝐡𝐞 March 2021 𝐋𝐨𝐰

𝐂𝐡𝐚𝐫𝐭 #7 - 𝐓𝐡𝐞 𝐀𝐮𝐠 9 2021 𝐋𝐨𝐰

𝐂𝐡𝐚𝐫𝐭 #8 - 𝐓𝐡𝐞 𝐌𝐚𝐲 16 2022 𝐋𝐨𝐰

𝐂𝐡𝐚𝐫𝐭 #9 - 𝐓𝐡𝐞 2011 (𝐀𝐓𝐇)

𝐂𝐡𝐚𝐫𝐭 #10 - 𝐓𝐡𝐞 2013 (𝐋𝐨𝐰)
PRICE ranges between major turning points (1971,1999,2011 etc) repeat in the future as TIME cycles that expand/contract in a geometric fashio.
*6/7: the 'sacred cut'
** 7/6: its reciprocal
PRICE ranges between major turning points (1971,1999,2011 etc) repeat in the future as TIME cycles that expand/contract in a geometric fashio.
*6/7: the 'sacred cut'
** 7/6: its reciprocal

𝐂𝐡𝐚𝐫𝐭 #11 - 𝐓𝐡𝐞 2016 (𝐇𝐢𝐠𝐡)
Notice the perfect square between price & time.
Note> of course at each major turning point there are many other things taking place.
Notice the perfect square between price & time.
Note> of course at each major turning point there are many other things taking place.

𝐂𝐡𝐚𝐫𝐭 #12
Since the onset of gold's bull market in 2015, the largest upswing was the move from the Mar'20 low to the Aug'20 ATH ($631). In the future, functions of this price range may define significant swing highs or lows.
Since the onset of gold's bull market in 2015, the largest upswing was the move from the Mar'20 low to the Aug'20 ATH ($631). In the future, functions of this price range may define significant swing highs or lows.

𝐂𝐡𝐚𝐫𝐭 #13 𝐓𝐡𝐞 𝐀𝐮𝐠'2022 𝐡𝐢𝐠𝐡
In our chart #12 analysis we noted the price range from the Mar'2020 low to the ATH ($630) & how we were expecting it to show up as a key time cycle. It came full circle from the 2008 low!
In our chart #12 analysis we noted the price range from the Mar'2020 low to the ATH ($630) & how we were expecting it to show up as a key time cycle. It came full circle from the 2008 low!

• • •
Missing some Tweet in this thread? You can try to
force a refresh


