#Priceaction
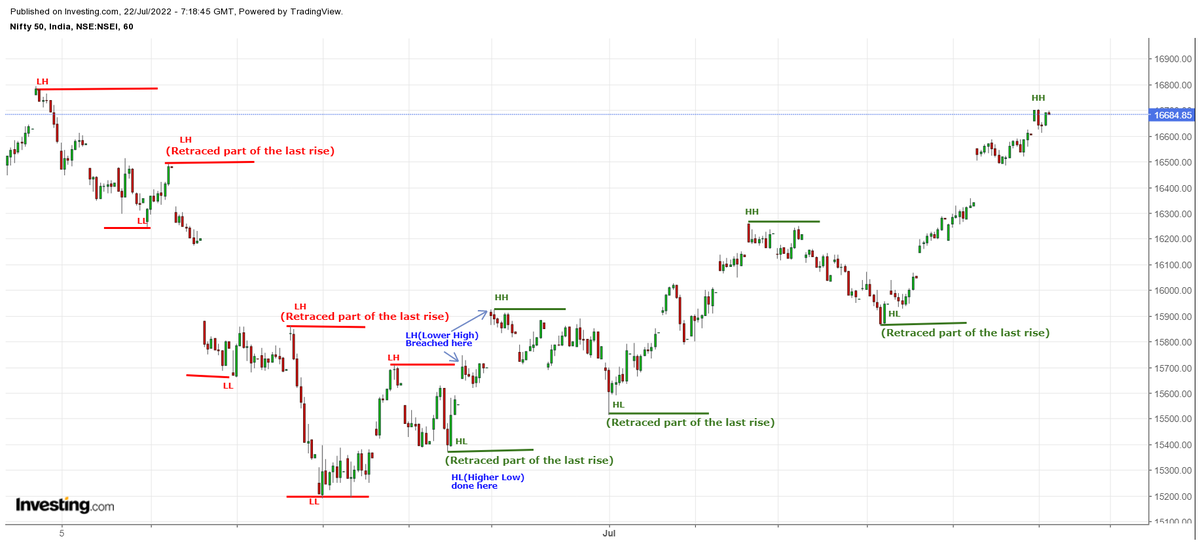
IF trader, then study "Hour chart" of at least 30 trading days
Watch how #prices are #Trending & you take a position when trend changes, say, from making "LH & LL" to "HL & HH" & Vice Versa
This is the 1st & foremost step & absolutely noiseless
#Retracement helps🙏
IF trader, then study "Hour chart" of at least 30 trading days
Watch how #prices are #Trending & you take a position when trend changes, say, from making "LH & LL" to "HL & HH" & Vice Versa
This is the 1st & foremost step & absolutely noiseless
#Retracement helps🙏
#Priceaction Step:2
All traders know Demand & Supply to exploit the difference - a basic trait of any trader/ businessman.
What captures this absolutely is #Trendline & #Channel
For Eg: When prices break out of a falling T.Line/ Channel, it means demand has overpowered supply
All traders know Demand & Supply to exploit the difference - a basic trait of any trader/ businessman.
What captures this absolutely is #Trendline & #Channel
For Eg: When prices break out of a falling T.Line/ Channel, it means demand has overpowered supply

That's first clue-buyers are asserting. LH & LL would soon change.
Next step is to look for a Fibonacci #retracement to hold @ 38% or 50% or 61.8% (to make HL) with a bullish candle like #Bullishengulfing or #Bullishpinbar @ a % of previous rise which is your perfect LRHR entry
Next step is to look for a Fibonacci #retracement to hold @ 38% or 50% or 61.8% (to make HL) with a bullish candle like #Bullishengulfing or #Bullishpinbar @ a % of previous rise which is your perfect LRHR entry
Having made "HL" & after your entry, look for earlier "LH" to be surpassed to make a "HH".
Remember always that every rise gets a #retracement & as long as the retraces are held @ maximum 61.8%(Golden ratio) or 78.6%, prices would continue to advance to maintain this HH & HL🙂🙏
Remember always that every rise gets a #retracement & as long as the retraces are held @ maximum 61.8%(Golden ratio) or 78.6%, prices would continue to advance to maintain this HH & HL🙂🙏
Go to in.tradingview.com or investing.com/indices site and start practicing
* identify sequence of LH & LL changing to HH & HL
& then changing again. Is it getting easier
* Start drawing trendlines or channels for price
advances & declines
* Do Fibonacci retracement
* identify sequence of LH & LL changing to HH & HL
& then changing again. Is it getting easier
* Start drawing trendlines or channels for price
advances & declines
* Do Fibonacci retracement
I have read @sunilgurjar01 's book on #Priceaction trading
It's the most affordable one @ INR.322
And, the risk reward of buying is 1:1000
It is the most comprehensive one covering the basics, candlestick pattern, price pattern, Risk management, Position sizing, etc
Go for it🙂
It's the most affordable one @ INR.322
And, the risk reward of buying is 1:1000
It is the most comprehensive one covering the basics, candlestick pattern, price pattern, Risk management, Position sizing, etc
Go for it🙂

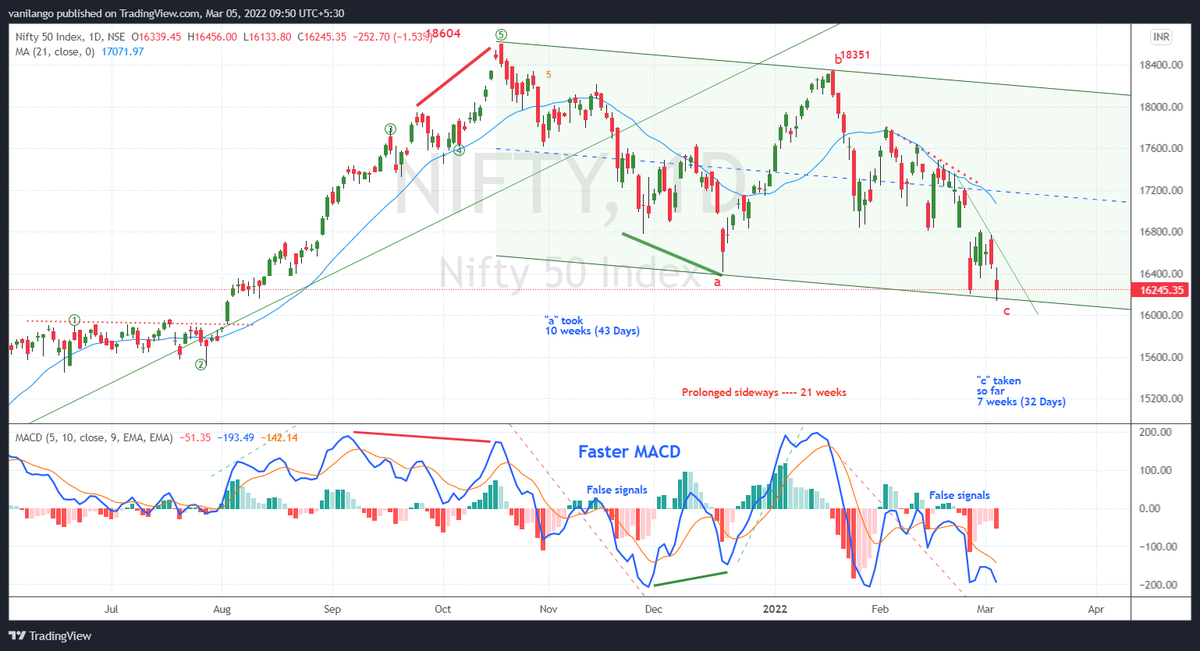
#Priceaction:
Step:1 Identify HH & HL or LH & LL to follow #trend
Step:2 Draw #trendline / #Channel & #fibonacci
#retracement
Step:3 Mark #clusters of Price struggle in Hour chart
Step:1 Identify HH & HL or LH & LL to follow #trend
Step:2 Draw #trendline / #Channel & #fibonacci
#retracement
Step:3 Mark #clusters of Price struggle in Hour chart
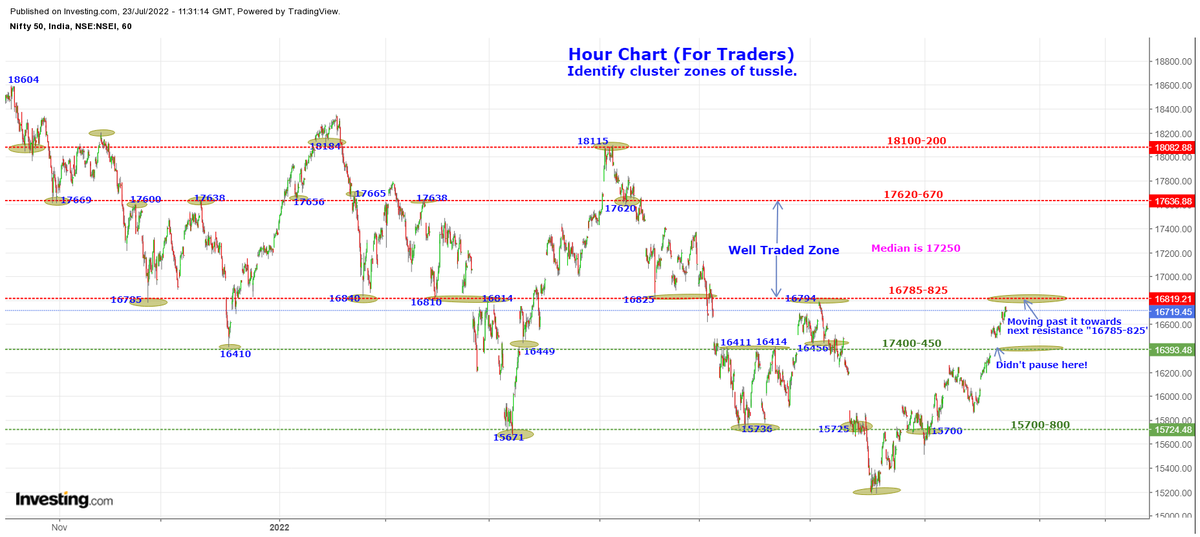
#nifty Hour chart from significant top @ 18604 in Oct.2021.
Mark wherein it took support at various points on it's way down as well as where it got resisted.
And, when you connect these clusters, they become support & resistance on the way up.
Now, repeat marking from "15183"
Mark wherein it took support at various points on it's way down as well as where it got resisted.
And, when you connect these clusters, they become support & resistance on the way up.
Now, repeat marking from "15183"
Hour chart as a background to draw larger #clusters of support & resistances, you could then move down to a "15 Minute chart" to identify #clusters to spot support & resistances.
These zones would help to stay alert when prices reach such zones during a weekly settlement period.
These zones would help to stay alert when prices reach such zones during a weekly settlement period.

• • •
Missing some Tweet in this thread? You can try to
force a refresh