Karen Braun Profile picture
Jul 26 4 tweets 2 min read
🇺🇸A brief history of U.S. #corn yield growth since the 1860s 🌽 Notable growth in yields was seen after the adoption of modern fertilizers in the 1940s, which made drought years esp. in the 1980s stand out more than before (compare with 1930s Dust Bowl for example).
I didn't include all possible difference makers on the chart, just the top ones, but there are probably other things I could include. Anyone have suggestions?

This shows just how bad the 1988 & 2012 droughts were (you can also see 1983, 1993, etc in there).
The first chart makes trend yield look like it's just up up up. But let's zoom in. Look at the last several years. What's really the trend? To me, 181 for 2022 seemed too high (USDA's original "unofficial" before planting delays). Input greatly welcome here, it's been on my mind.
Also interesting to point out here, although we have made several new records in the last decade, the 1994 and 2004 #corn crops were probably among the most epic in a long time and we haven't seen success like that since. I'm sure expansion of acres/regions could be a factor.

• • •

Missing some Tweet in this thread? You can try to force a refresh
 

Keep Current with Karen Braun

Karen Braun Profile picture

Stay in touch and get notified when new unrolls are available from this author!

Read all threads

This Thread may be Removed Anytime!

PDF

Twitter may remove this content at anytime! Save it as PDF for later use!

Try unrolling a thread yourself!

how to unroll video
  1. Follow @ThreadReaderApp to mention us!

  2. From a Twitter thread mention us with a keyword "unroll"
@threadreaderapp unroll

Practice here first or read more on our help page!

More from @kannbwx

May 31
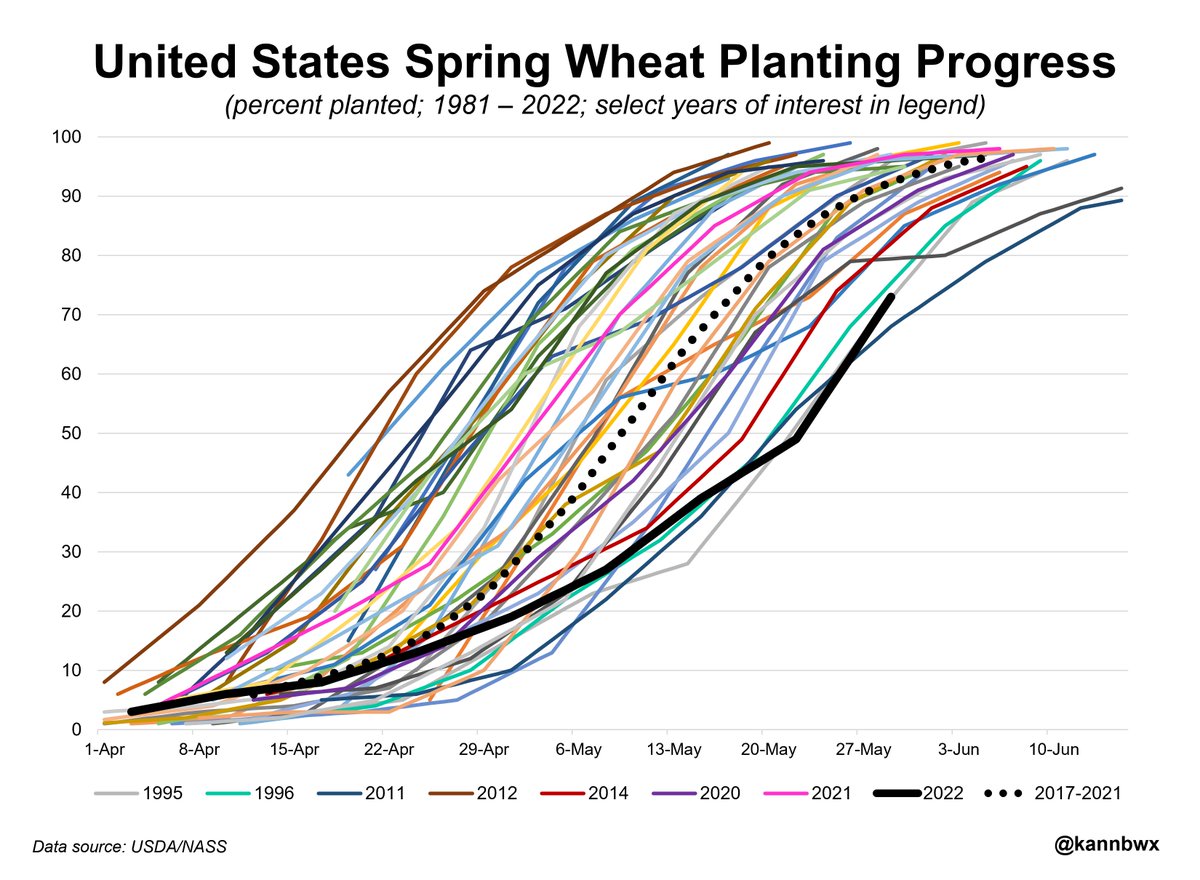
U.S. spring #wheat planting was near record slow as of Sunday at 73% complete, as wet weather has delayed top growers North Dakota & Minnesota. Spring wheat accounts for 32% of the full U.S. wheat crop, and last year's spring harvest was the smallest since 1988 due to drought.
North Dakota grows about half of the U.S. spring #wheat, but Minnesota, accounting for 14% of production, is planting at the slowest pace ever. Almost no wheat got planted in the state until last week. Still, it is uncertain just how many of MN's intended acres will get planted.
Only 29% of U.S. winter #wheat was in good/excellent health as of Sunday, the lowest for the week since 2006. Other years with similarly low ratings had terrible yields. However, the winter wheat problems have been known for some time now. Wasn't much room for spring crop errors.
Read 4 tweets
May 31
North Dakota is planting #corn & #soybeans at a record slow pace, corn by a comfortable margin. Only 56% of ND's corn was planted by May 29, and May 25 was the last day for most ND farmers to plant 🌽 and be fully eligible for elected crop insurance. ND grows 3% of U.S. corn. Image
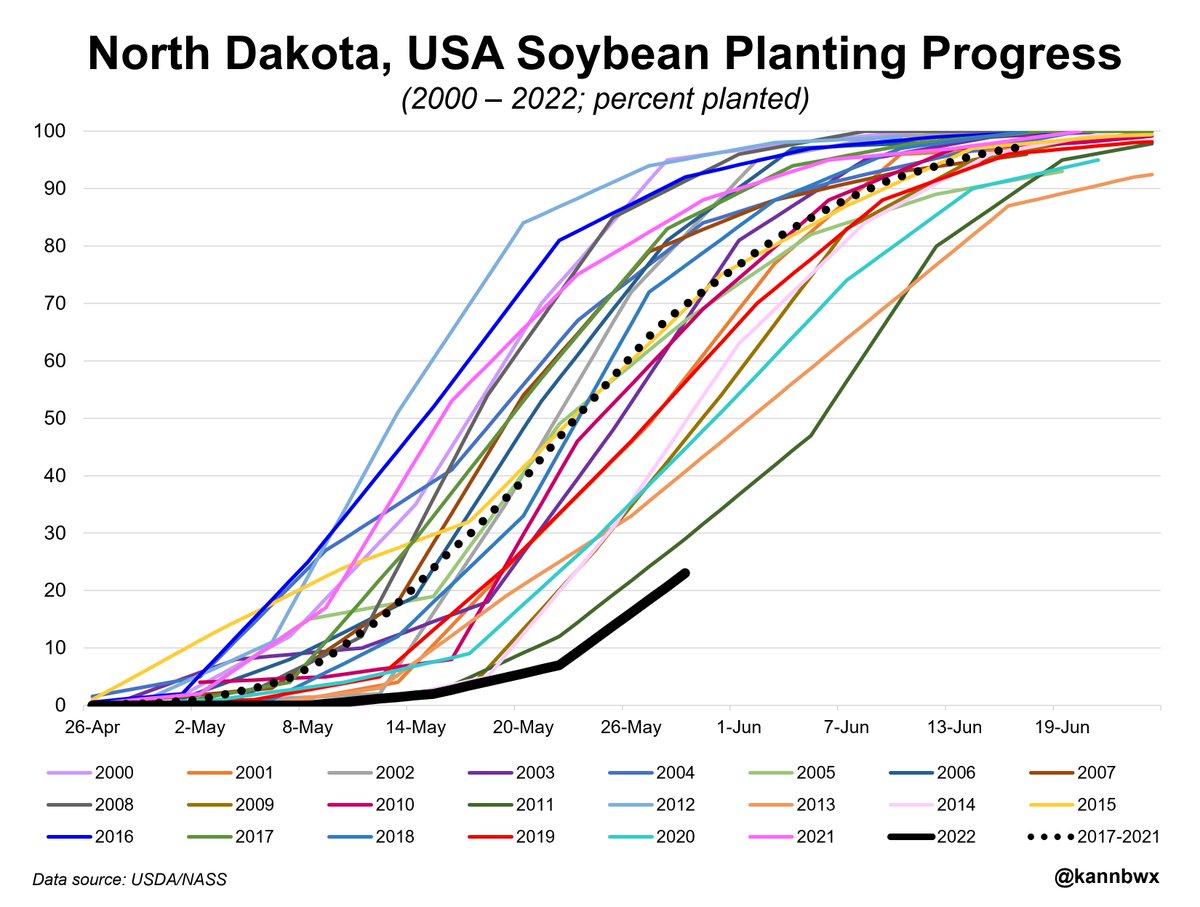
North Dakota grows 5% of U.S. #soybeans, a large portion of which get exported to China. Only 23% of ND's beans were planted by May 29 vs 86% last year. Final crop insurance planting date is June 10, but to complete planting, ND cannot have any more rainy episodes from here. Image
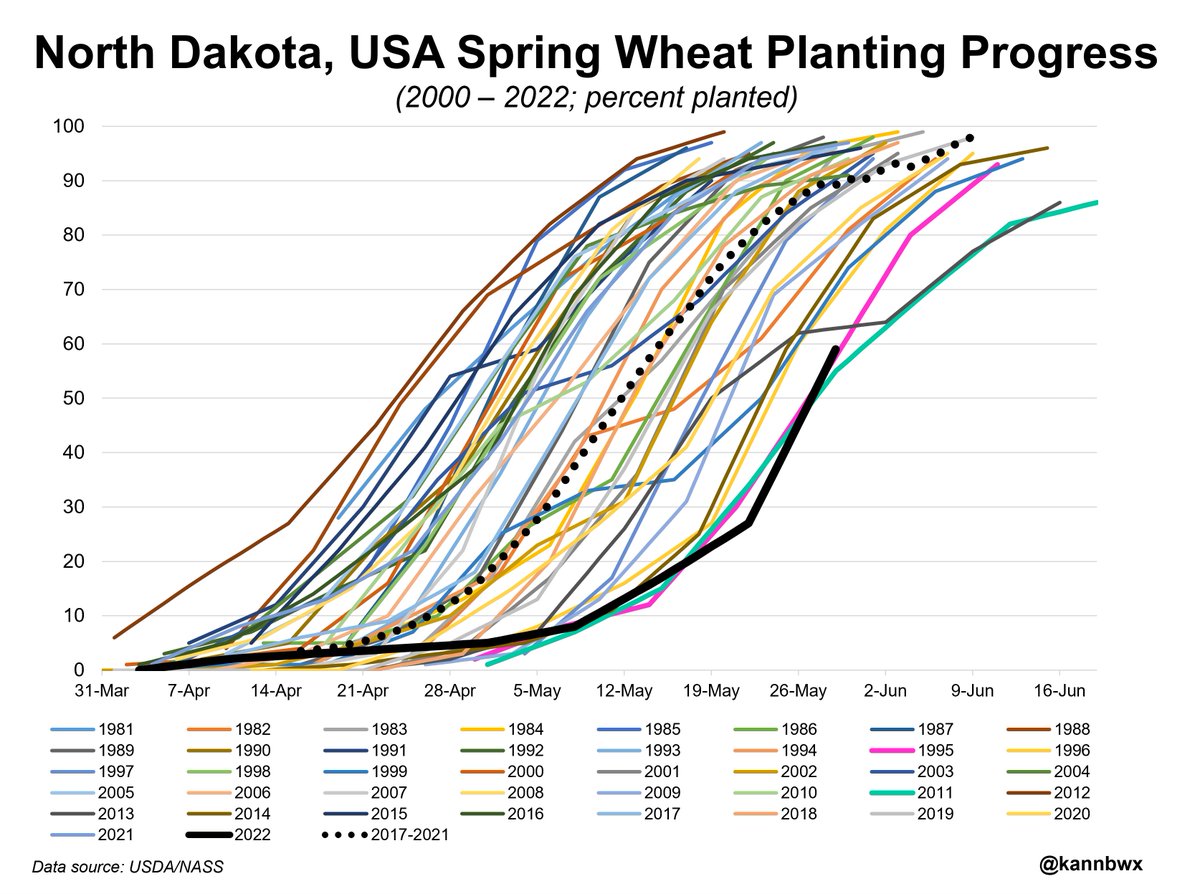
North Dakota's spring #wheat planting is no longer slowest ever (but it's close) at 59% complete by May 29. Final planting date is either May 31 or June 5, but 91% of ND's wheat should be planted by now. ND grows half of the country's protein-rich spring wheat. Image
Read 7 tweets
May 26
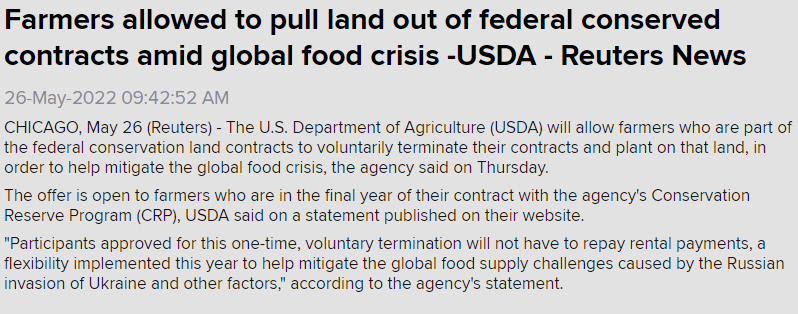
USDA will allow U.S. farmers to plant on acres currently parts of the federal conservation program with no penalty in order to ease global food supply worries. The offer is open to farmers in the final year of their contract with USDA's CRP program.
I've discussed this before on here. Given that June is in less than a week, I believe farmers would have needed significantly more notice in order to make anything happen this year. Don't forget, planting crops is incredibly expensive this year.
Just one year ago (when grain prices were already at multi-year spring highs), USDA was attempting to add more acres to CRP in both the short and long term for climate mitigation purposes. That announcement is here:
fsa.usda.gov/news-room/news…
Read 4 tweets
May 24
May 24: Most-active CBOT #corn futures settled below the 50-day moving average for the first time since Oct. 21, 2021. The settle of $7.71-3/4 per bushel is 6.4% off the April 29 high of $8.24-1/2. 100-day avg as of Tuesday is about $7.14. Image
A longer term picture. Closing below the 50-day avg is generally a negative technical sign, but it isn't guaranteed. Corn settled below the 50-day on March 30, 2021 for the 1st time since Aug. 12, 2020, then didn't do it again til June. Though now, corn is near historic highs. Image
U.S. planting progress and China/Brazil trade prospects weighed down the corn market Tuesday. U.S. corn planting is still historically slow, but not 2019, no-end-in-sight slow. China cleared Brazilian corn for import, causing concerns for US competitiveness into China.
Read 4 tweets
May 24
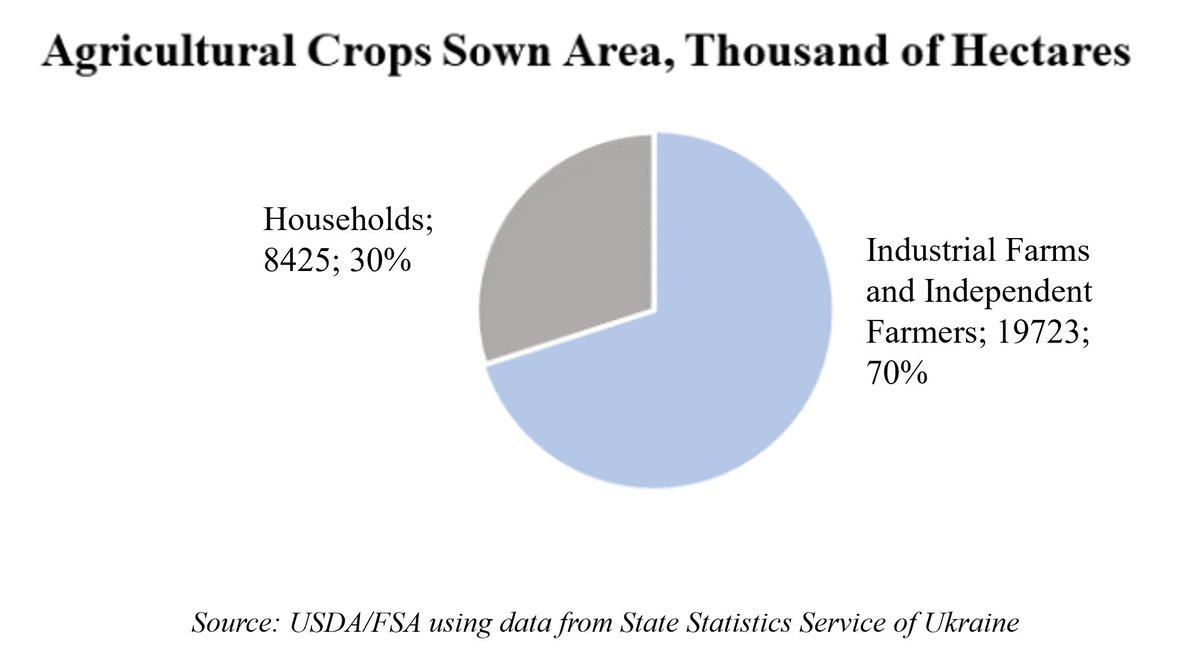
USDA's attache in #Ukraine has just published its first report since the Russian invasion on Feb. 24. Topic is role of Ukrainian households in agricultural production, now extra important for food security given the war. Households occupy 30% of ag land. Potatoes are a top crop. Image
We missed Grain & Feed/Oilseeds annual reports, incl. 2022/23 projections. USDA hasn't necessarily said its Kyiv attache is not operating, but info remains thin. Report says #Ukraine's State Statistics Service has officially stopped publishing all new data until the war is over.
So really, question is: is USDA's info stream out of Ukraine sufficient? Reliable? I asked that Q at the USDA Data Users' meeting in April and got a kinda evasive answer. But lack of reports instills at least some doubt, some question. Here's the report: apps.fas.usda.gov/newgainapi/api…
Read 4 tweets
May 24
#China has signed an agreement with #Brazil to allow imports of 🇧🇷 #corn, previously subject to phytosanitary restrictions.

These are Brazil's top customers. Iran, Egypt & Spain in particular overlap with Ukraine, China's usual go-to supplier. Japan and S Korea overlap w/ USA. Image
Those original 7 countries I showed account for 2/3 of #Brazil's annual #corn shipments. Taiwan also overlaps with USA, as does Mexico when adding some secondary Brazilian buyers.

Will be lots of secondary overlaps because countries that don't grow corn NEED corn! 🌽 Image
Here's a reminder of where USA, #Ukraine & #Argentina export #corn for comparison. Two USA charts: 1 shows recent buyers and then another shows buyers' shares pre-#China (China started buying US big in 2020). Argy chart is from USDA/FAS.

USA+BR+AR+UA = 85% of world corn exports ImageImageImageImage
Read 4 tweets

Did Thread Reader help you today?

Support us! We are indie developers!


This site is made by just two indie developers on a laptop doing marketing, support and development! Read more about the story.

Become a Premium Member ($3/month or $30/year) and get exclusive features!

Become Premium

Don't want to be a Premium member but still want to support us?

Make a small donation by buying us coffee ($5) or help with server cost ($10)

Donate via Paypal

Or Donate anonymously using crypto!

Ethereum

0xfe58350B80634f60Fa6Dc149a72b4DFbc17D341E copy

Bitcoin

3ATGMxNzCUFzxpMCHL5sWSt4DVtS8UqXpi copy

Thank you for your support!

Follow Us on Twitter!

:(