Technical Trades Profile picture
Aug 27, 2022 β€’ 9 tweets β€’ 7 min read β€’ Read on X
Are you a good stock market trader?

Become better & improve yourself

πŸ˜ŽπŸ’‘πŸ“ˆπŸ“ŠπŸ’°

with @Stocktwit_IN @TradingView_IN

#trading #learning #StockMarket
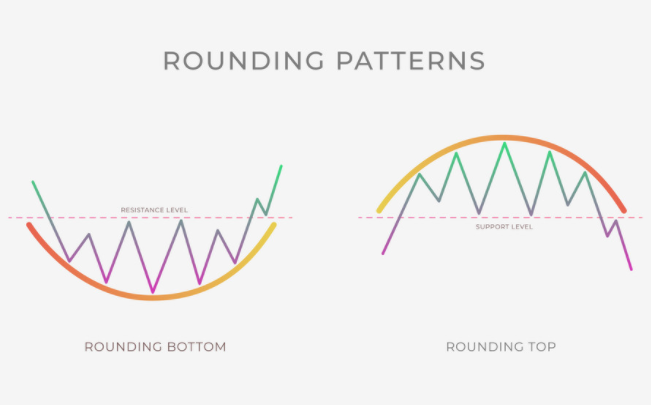
Learn some Classic and very useful chart patterns TODAY!

πŸ“ˆπŸ“‰β¬†οΈβ¬‡οΈ
Trend Lines are very useful on Charts

#Chart #Trader
Some indicators on charts you MUST KNOW

🏹🏹🏹
How single #Candle patterns are working to generate Highly profitable signals in trading?

Learn Here πŸ‘‡πŸ‘‡
Are you trading in #India?

Follow best trading timings
β°πŸ•€πŸ•‘πŸ•ž
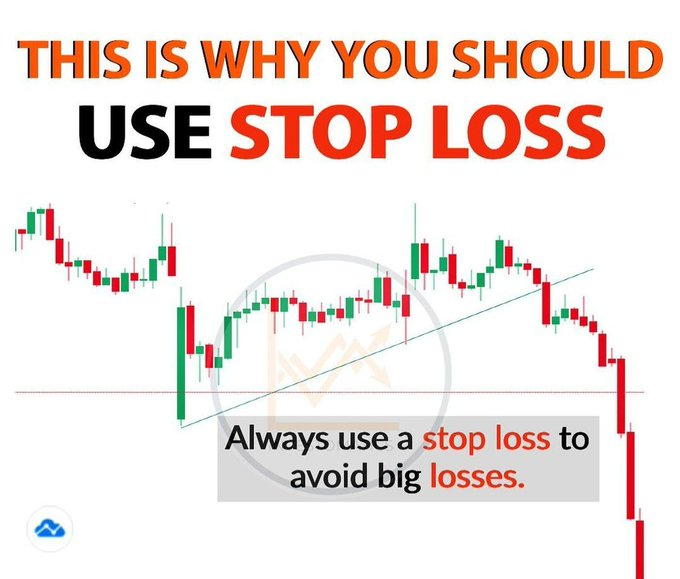
Hey Bro... Never forget this in Trading

This is your BEST Friend - Stop Loss

βœ‹πŸ›‘πŸš¦
With Trading, you should also do some #investing

πŸ’΅πŸ’ΈπŸ’°

β€’ β€’ β€’

Missing some Tweet in this thread? You can try to force a refresh
γ€€

Keep Current with Technical Trades

Technical Trades Profile picture

Stay in touch and get notified when new unrolls are available from this author!

Read all threads

This Thread may be Removed Anytime!

PDF

Twitter may remove this content at anytime! Save it as PDF for later use!

Try unrolling a thread yourself!

how to unroll video
  1. Follow @ThreadReaderApp to mention us!

  2. From a Twitter thread mention us with a keyword "unroll"
@threadreaderapp unroll

Practice here first or read more on our help page!

More from @TechTradesTT

Sep 8, 2023
Hi Friends,

Sharing some useful #trading threads with @Stocktwit_IN & @TradingView_IN

#Like & #Repost for Max Reach

it's 100% FREE πŸ–

1- Technical Analysis, a candlestick pattern -- part 1

Some Complex candlestick patterns ---- thread Part 2

How to create a watch list before market opening- A thread

Read 7 tweets
May 14, 2023
In Technical Analysis, a candlestick pattern is a movement in prices shown graphically on a candlestick chart that some believe can predict a particular market movement.

A thread 🧡 with @Stocktwit_IN & @TradingView_IN

#TechnicalTrades #TradingView Image
History: Some of the earliest technical trading analysis was used to track prices of rice in the 18th century. Much of the credit for candlestick charting goes to Munehisa Homma (1724–1803), a rice merchant from Sakata, Japan who traded in the Ojima Rice market in Osaka
#stocks
Formation of the candlestick: Candlesticks are graphical representations of price movements for a given period of time. They are commonly formed by the opening, high, low, and closing prices of a financial instrument.

#priceaction #StocksToTrade
Read 11 tweets
Sep 25, 2022
Elliott / ABC Wave Theory

Elliott Wave Theory, or ABC wave theory, is a term for three-wave counter trend price movement.

With @Stocktwit_IN & @TradingView_IN

#TradingView #stocks #nifty #niftybank #trading #priceaction
Here, wave A is the first price wave that is against the trend of the entire market. B wave is a corrective wave for wave A. Wave C shows the final price move to complete the counter trend price move.
RememberπŸ‘‡

Alphabetical labeling helps to differentiate between the degree or level of the wave. It speaks to the span of the basic pattern.
Read 6 tweets
Sep 12, 2022
Intraday trading tips and tricks

As the name suggests, Intraday Trading is the process of buying and selling stocks on the same day. Basically, you buy stocks on daily basis, you look for a reasonable price to sell it and then earn your profit. Image
Daily analysis and research is necessary for Intraday Trading. The movement of the market’s momentum must be reflected in the strategy used by a trader. Image
It is advisable to look for liquid shares for Intraday Trading. As the trader needs to square-off their position at the end of the day, it is better to go for large cap shares. Image
Read 8 tweets
Aug 15, 2022
Most Essential Stock Chart Patterns
With @Stocktwit_IN

THREAD 🧡
1. Ascending triangle
2. Descending triangle
3. Symmetrical triangle
4. Pennant
5. Flag
6. Wedge
7. Double bottom
8. Double top
9. Head and shoulders
10. Rounding top or bottom
11. Cup and handle
Cup and handle:
The cup and handle is a well-known continuation stock chart pattern that signals a bullish market trend. The cup appears similar to a rounding bottom chart pattern, and the handle is similar to a wedge pattern
Rounding top/bottom:
The rounded top and bottom are reversal patterns designed to catch the end of a trend and signal a potential reversal point on a price chart.
Read 12 tweets
Aug 14, 2022
Do you have what it takes to be a successful trader?

Study after study say that it is discipline that differentiates a successful trader from a not so successful one. Consistent result is the outcome of a disciplined trader. How do you get this right? Here are valuable tipsπŸ‘‡πŸ‘‡
Firstly, what is Discipline?
It’s important that we first understand what discipline is. The definition is – the practice of obeying rules or a code of behavior
Note it down.
To start with make a note. A note on your precise trade plan. What will be your criteria for entry and exit, investment management and trade management plan? You may know it but if you do not note it down it can be forgotten or very easily you could lose the track.
Read 7 tweets

Did Thread Reader help you today?

Support us! We are indie developers!


This site is made by just two indie developers on a laptop doing marketing, support and development! Read more about the story.

Become a Premium Member ($3/month or $30/year) and get exclusive features!

Become Premium

Don't want to be a Premium member but still want to support us?

Make a small donation by buying us coffee ($5) or help with server cost ($10)

Donate via Paypal

Or Donate anonymously using crypto!

Ethereum

0xfe58350B80634f60Fa6Dc149a72b4DFbc17D341E copy

Bitcoin

3ATGMxNzCUFzxpMCHL5sWSt4DVtS8UqXpi copy

Thank you for your support!

Follow Us!

:(