#Bihar
1) Throughout the entire south west monsoon season, Bihar and the catchments of the rivers that flow through it have been facing deficit rainfall. But.. Image
2) Throughout the entire season, Kosi river has been flowing above warning level for every day and above danger level almost every day!

Isnt it odd that a river basin that is facing deficit and drought like situation have flood too simultaneously? Image
3) The primary reason is Bihar's topography and our failed methods of attempting to control them. Bihar has an extremely flat terrain, that just 1.5 m rise in Kosi river can cause it to flood.. Image
And the effect of the embankments can be read here in this thread

More on Embankments Image
If a river can flood during an year of deficit, imagine what would happen in an year of average or higher rainfall.

• • •

Missing some Tweet in this thread? You can try to force a refresh
 

Keep Current with Raj Bhagat P #Mapper4Life

Raj Bhagat P #Mapper4Life Profile picture

Stay in touch and get notified when new unrolls are available from this author!

Read all threads

This Thread may be Removed Anytime!

PDF

Twitter may remove this content at anytime! Save it as PDF for later use!

Try unrolling a thread yourself!

how to unroll video
  1. Follow @ThreadReaderApp to mention us!

  2. From a Twitter thread mention us with a keyword "unroll"
@threadreaderapp unroll

Practice here first or read more on our help page!

More from @rajbhagatt

Oct 3
I am yet to write all my suggestions related to the climate action plan for Chennai which has been open for suggestions

But wanted to say this:
Please DON'T take all these sea level rise maps from the report that depends on climate central. These are INCORRECT.
@chennaicorp Image
What is wrong:
1. Elevation models used for these analyses are incorrect
2. climate changed induced sea level rise wouldn't act like a bath tub where water rises just like that
3. There would be formation of new beaches and erosion and would be different from current topography
4. We dont have a good estimate (as our models dont have sufficient data) to predict such change

As much as a false negative, a false positive is also a problem as it gives wrong projections of who would be affected. It gives wrong sense of priorities also.
Read 5 tweets
Aug 27
Short Story: 🧵

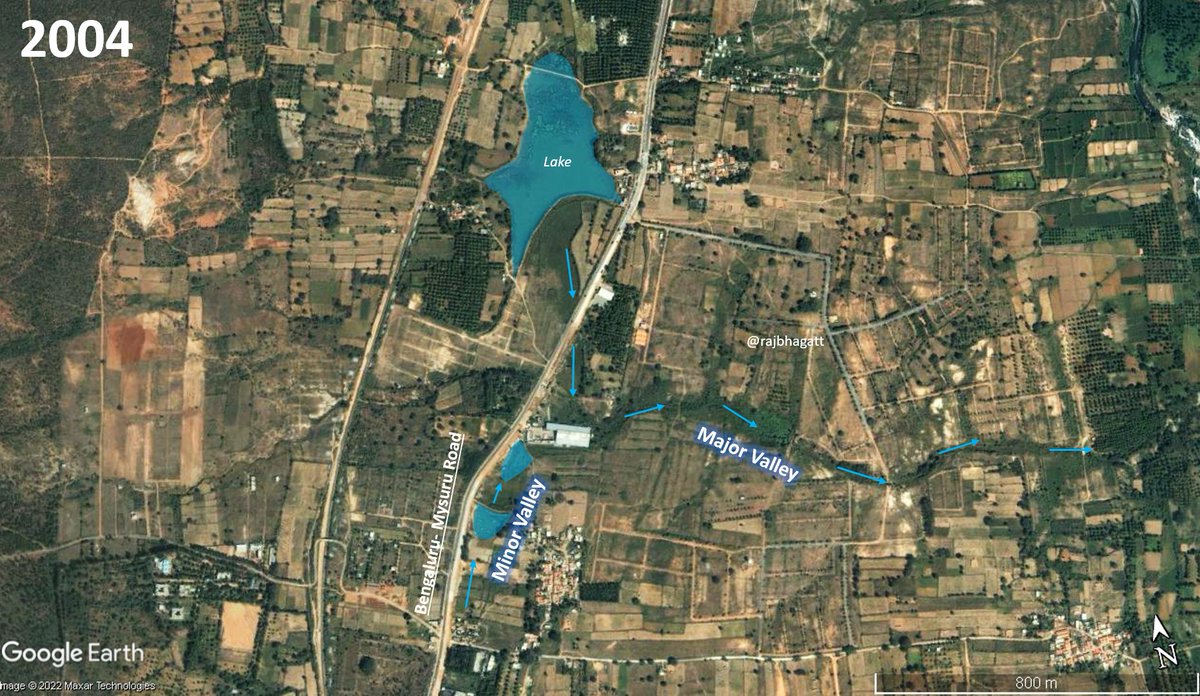
Near wonderla exit in #Bengaluru - Mysuru road, there existed a valley system (flow directions indicated below). Few irrigation tanks were also there in the valley (marked in blue).

1/n
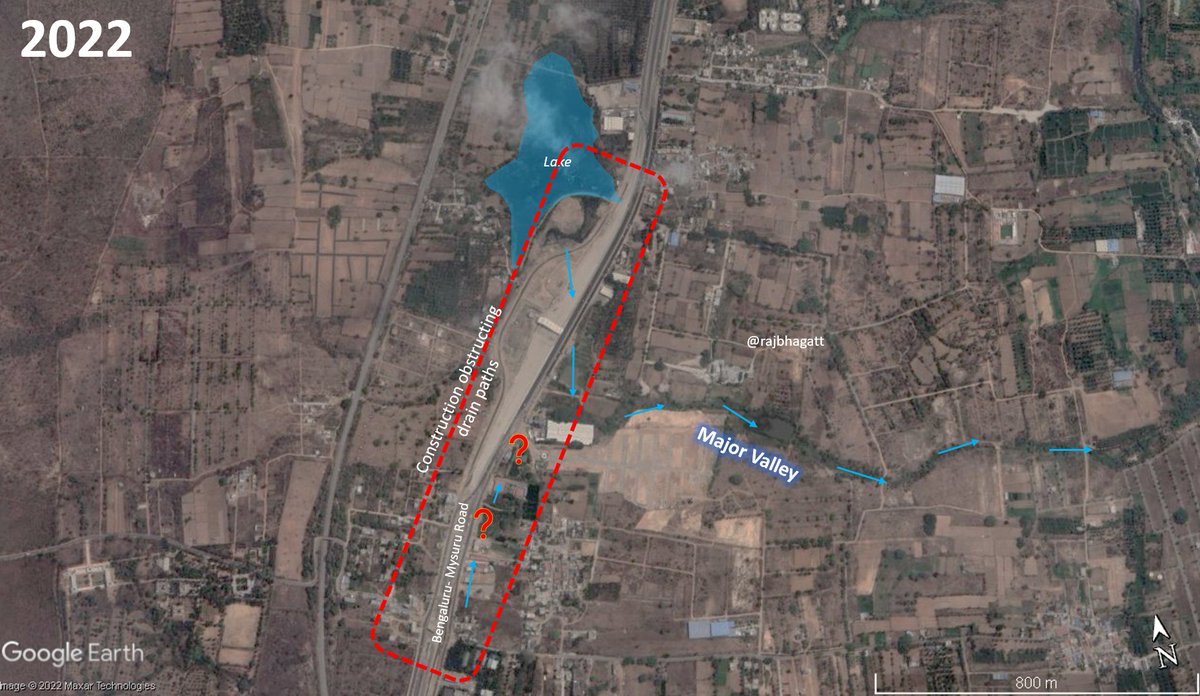
The construction spree on top of the valley system started when the road was expanded along with a toll gate right on top of valley! And other builtup came along the highway too completely causing the valley system to be obstructed.

2/n
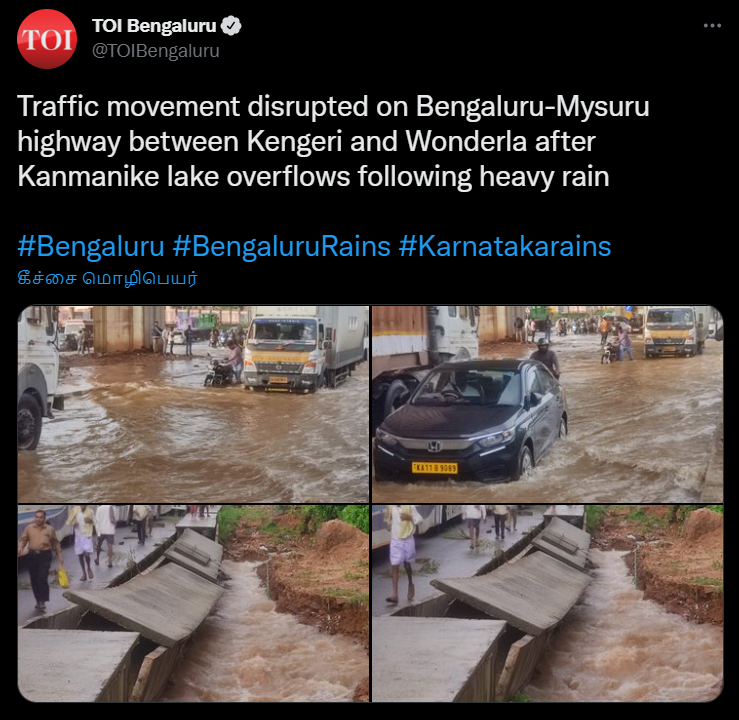
After heavy rain, the water couldn't move anywhere as there were no drainage alternatives. So it began stagnating and moving on top of the roads!

3/n
Read 7 tweets
Jul 2
Short #Thread:

Though heavy rainfall is the trigger, our construction practices of where and how are the biggest causes behind some of the most devastating landslides that are costing both lives and money for us.

1/n
Image shows a relatively well vegetated hill slope in #Manipur in 2009
2/n
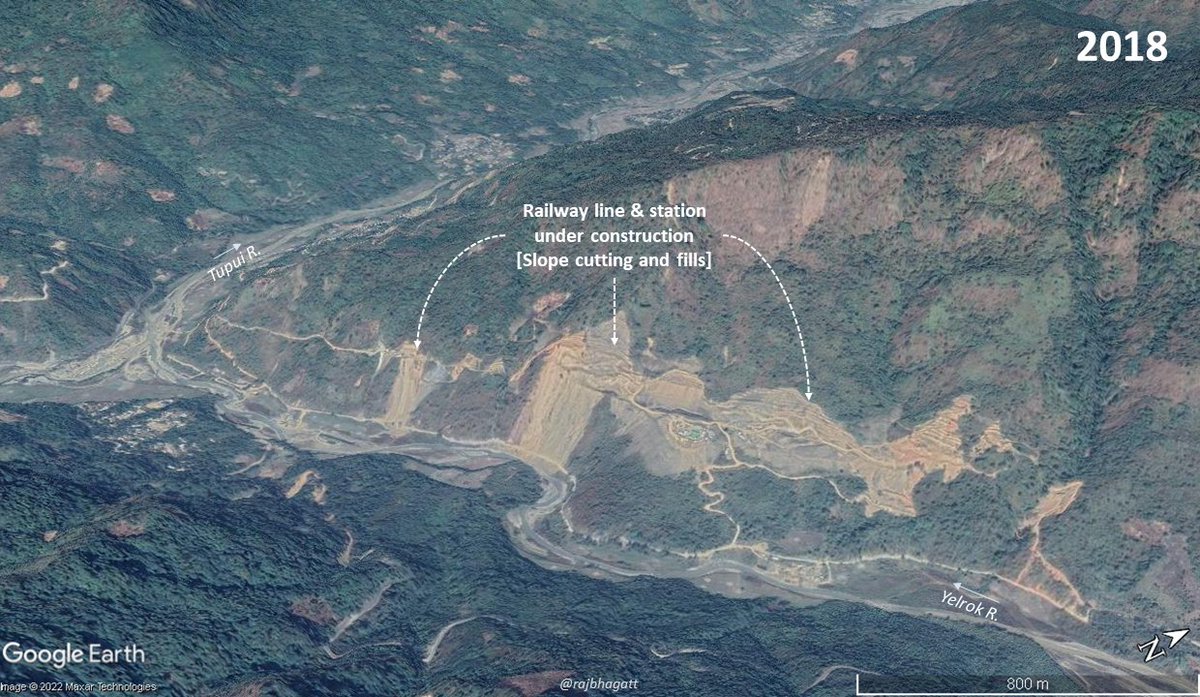
When a railway line was built along the slope (alongwith many roads), lots of slope cutting, vegetation clearances took place in the region.

3/n
Read 10 tweets
Jun 11
Short #Story of a river, a sea, a fishing village, and a groyne

Satellite image from 2005 shows the delta of Porunai river (Thamirabarani) in Thoothukudi district of Tamil Nadu.

1/n Image
The river settled some amount of sand in the sea and close to the mouths the sea was shallower and with lots of sand.

2/n Image
A village (Punnaikayal) was dependent on this onfluence of the river and the sea but the fishing boats had difficulty in moving particularly during low tides

3/n Image
Read 10 tweets
May 16
#Thread:

#Visualization shows ownership of Cars, Bicyle, Two wheelers and also the households that dont own any of these

Why is this critical to know?

Prepared by @PratapVardhan @Stats_of_India
h/t @indiainpixels
Before going into the thread, let us clarify about the data. The data is an end product of a survey which surveyed around ~6,40,000 households across India

Data represented in this viz are aggregated at state level so rural-urban or other geo nuances might be hidden

2/n
Also they indicate ownership of vehicles and it would not truly reflect the transport mode share which in particularly urban areas, everyday commute in personal vehicles could be lesser as some people would take public transportation

3/n
Read 12 tweets
May 3
This is a bridge across the #Chambal river near Morena (on the Madhya Pradesh side of the river), massive sand mining operations are happening right below the bridge! So many bridges across India have collapsed because of this activity
More images...
Read 5 tweets

Did Thread Reader help you today?

Support us! We are indie developers!


This site is made by just two indie developers on a laptop doing marketing, support and development! Read more about the story.

Become a Premium Member ($3/month or $30/year) and get exclusive features!

Become Premium

Don't want to be a Premium member but still want to support us?

Make a small donation by buying us coffee ($5) or help with server cost ($10)

Donate via Paypal

Or Donate anonymously using crypto!

Ethereum

0xfe58350B80634f60Fa6Dc149a72b4DFbc17D341E copy

Bitcoin

3ATGMxNzCUFzxpMCHL5sWSt4DVtS8UqXpi copy

Thank you for your support!

Follow Us on Twitter!

:(