ltrd Profile picture
Oct 21 24 tweets 6 min read
How to understand your prediction model and use it in real algorithmic trading? 🧵🧵🧵

Get a cup of tea or coffee and enjoy new knowledge.

#Trading #MachineLearning #ExplainableML #xAI #Shapley
In AlgoTrading it is really important to understand why your model and strategy work or does not work. Having that knowledge, you can adjust your features, build a better model or use this model in other cases.
I do not believe in putting some data creating for 1 day and doing Neural Networks in order to beat the market. In order to do it, you have to dig deep down into the data, and eventually you will find something good.
The models and data that I will provide here are 100% REAL. It is not random or synthetic data that will bring me 99% accuracy and beautiful plots. It is a real case with real data.
In HFT you have a really low signal-to-noise ratio so your model will not be the same as you have at university lectures.
Assume that you have your model that wants to predict something (in my case to predict 5 minutes log return). My model is XGBoost on 14 features [X1, …, X14].
In our case study, the model is not the most important. The most important is how to explain it and take more information from the fitted model. In order to do that we will use a python package called shap.
“Shapley values” is a concept from game theory that was brought after years into the Machine Learning models. Features are players, the outcome is a prediction. Our goal is to distribute the payout to the players (player importance)
Player importance in the game is an equivalent of feature importance in our model. The original papers and more can be found at this link → library.fa.ru/files/roth2.pdf
On the plot, you have all of the features. Each dot is an observation from a particular feature and its impact on model output. The more on the right, the more positive impact (in our case bigger log return within 5 minutes)
Red values correspond to higher values for the feature. Let’s consider feature X11. It is visible that most of the red values are on the right side. It means that a lot of high values of X11 corresponds to higher log return.
The most interesting features are those where the colors are split into two parts - one color for the left and one color for the right side. It means that there is a clearer impact of features on the outcome.
Those features in our case are X2, X3, X13, X11, X6, X14 and those are the features that you would like to scrutinize more. The most important thing is to be sure that it is intuitive that this feature impact prediction in this way.
For example, if you have a feature that is a measure for liquidity on the bids it should show you more red values on the right side because more liquidity on the bids means more buy pressure.
The second thing that you can do is to plot feature importance for a particular model - here it is XGBoost. You have this method implemented and you can use it after you fit your model.
You can see that the ranking is not the same as in the shap values and it is a really interesting problem in Explainable Machine Learning called the Disagreement Problem. See arxiv.org/abs/2202.01602.
One of the most valuable things when you look at the dependence plot for shapley values. You can see here the values of feature X14 and the shap value (impact on the outcome) with interaction with feature X1.
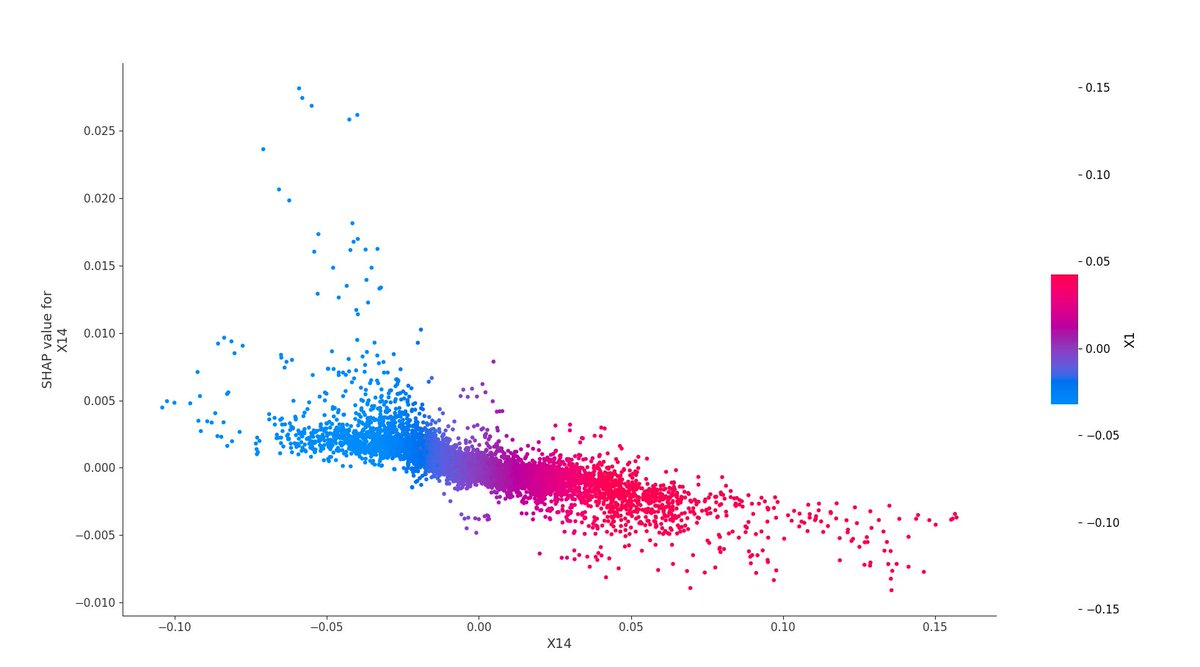
You can see linear dependence between 5 minutes log return and the X14 feature. And what is even more important is that X1 can split it into two parts. Low values of X1 correspond to lower values of X14 and higher prediction.
REALLY IMPORTANT: Every feature brings you some knowledge about the market and the model. Don’t screw it. Ask yourself what this feature or this interaction wants to tell you.
Maybe you should create two market regimes based on the interaction between those two features. Or maybe some feature has a lot of outliers and those outliers are matched with some values for other feature.
Why X13 has really strange shapley values for X13 > 0.0008 and why they are all corresponding to the really low values of the X14? These are the questions that you have to ask yourself.
This is how I do my analysis and how I learn more about the market. Remember that this is only my opinion and you should think for yourself. Nobody can do it for you.
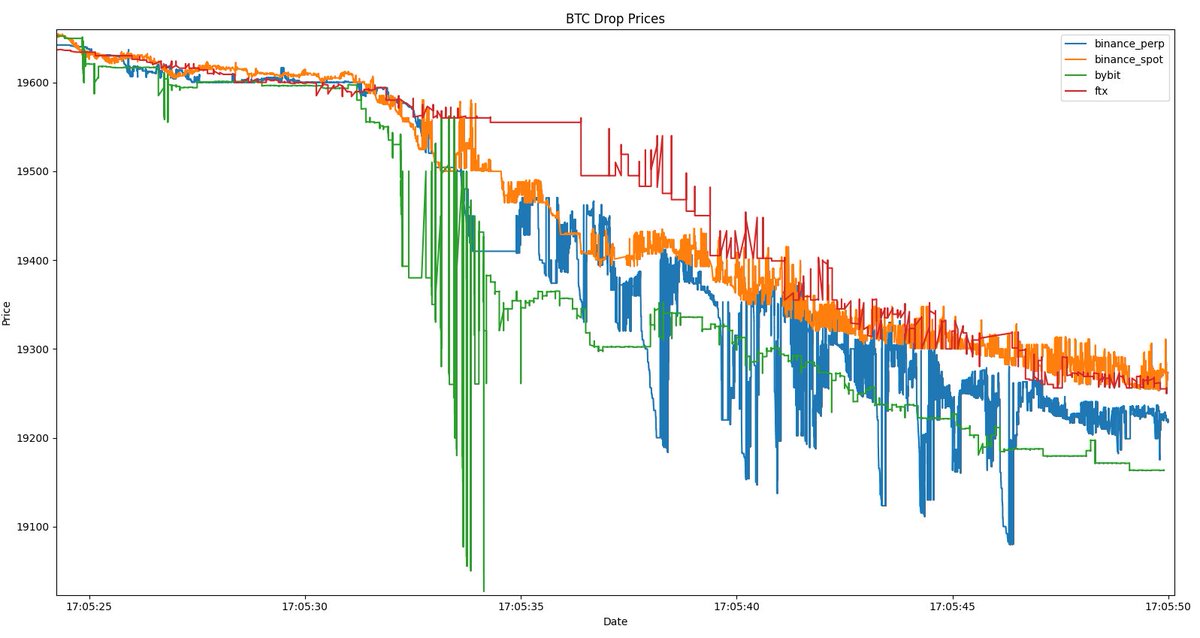
It is really hard to monetize ML model in HFT. Even if you know that the price will be higher within 1 second there are tons of possibilities for how to use this knowledge, so you have to be creative.
I hope that it was an interesting analysis for you. Thank you for your reading. Good luck.

• • •

Missing some Tweet in this thread? You can try to force a refresh
 

Keep Current with ltrd

ltrd Profile picture

Stay in touch and get notified when new unrolls are available from this author!

Read all threads

This Thread may be Removed Anytime!

PDF

Twitter may remove this content at anytime! Save it as PDF for later use!

Try unrolling a thread yourself!

how to unroll video
  1. Follow @ThreadReaderApp to mention us!

  2. From a Twitter thread mention us with a keyword "unroll"
@threadreaderapp unroll

Practice here first or read more on our help page!

More from @ltrd_

Oct 5
How to analyze, visualize and use alpha from the feature? 🧵

I would like to show you methods for analyzing some features that you will find in the data. Everything is used in practice, without fancy words and ML methods. For quants and beginners coming from manual trading.
A lot of times you find some feature that you would like to analyze. It can be something simple like the difference between some moving averages as well as some sophisticated metric related to the influx of new trades into the particular market.
The problem is how to use analyze the feature, extract valuable information from it, and create a strategy based on it. I would like to show you how I do it often in practice. Every case is different, but I just want you to know how you can manipulate data and perform reasoning.
Read 22 tweets
Sep 21
How they played the FOMC? -> precise analysis of market microstructure during the news.

A lot of plots, analyses, and conclusions about how traders reacted to the news. Go for a tea or coffee and please enjoy my work 🧵
Firstly, for getting familiar with the situation - let's look at the price. Today I will focus mostly on the BinanceFutures perp on BTCUSDT. First of all, we see that the movement started before 6 p.m. UTC.
The first big market orders came to the market at about 17:59:53.651 when somebody bought 540BTC and that order ate 526 levels in the orderbook. After that, a lot of orders came with the maximum at 1293BTC 4 seconds later.
Read 20 tweets
Sep 6
I analyzed data from a couple of exchanges related to today’s drop in the crypto market. Of course, I focused on BTC because it was seen that BTC was the catalyst. Prepare tea or coffee, focus yourself for a couple of minutes and come with me on the data journey.
First look at the trade data from exchanges. As you can see - absolute wild west on the plot. You have to have watermelon balls if you want to be a market maker on such a market. Sometimes it pays off but it is highly uncontrolled, so the profit is random with high variance.
It can be seen that due to the high volatility and latency of the order execution, liquidity on ByBit disappeared. Probably (as far as we all know ByBit) some giga degen chads were liquidated and no market maker wanted to take this liquidity.
Read 14 tweets
Sep 3
I read some tweets about market microstructure, especially related to the fact that you have a difference between fees and tick sizes. I performed some small analyses in order to show you that those markets are completely different

#trading #cryptocurrency #Binance
I analyzed three different instruments: BTCUSDT spot on Binance, CHZUSDT spot on Binance, and BTCUSD perp on ByBit. On the ByBit you have a much higher taker fee than on Binance and on CHZUSDT you have a much bigger tick size than on BTCUSDT on the Binance spot.
Firstly I want to show you what is the difference between instantaneous market impact which will be measured as the number of levels that disappeared from the orderbook after the market order.
Read 10 tweets
Jul 31
Market Generators #1

Today I started doing something with Market Generators, as I said before. After spending some time reviewing my fundamentals in stochastic calculus, I started implementing simulations of price paths based on GBM.
First of all, we have to know what the GBM - Geometric Brownian Motion - is. It is a process that is used widely in Finance, especially in the Black-Scholes model. Before GBM, Brownian Motion was used, but we are not sure if our prices will be positive with BM.
I used ZILUSDT as my instrument. What I want to do is to create synthetic data that is in some measures similar to the ZILUSDT in order to perform backtesting not only on real ZILUSDT data but also on synthetic data.
Read 9 tweets
Jun 27
Very interesting behavior on BinanceFutures related to the trades on APEUSDT. It looks like there are simultaneously done orders on two sides with a big market impact. There is the more interesting thing if we will see closer...
#trading #HFT #cryptocurrecy #Binance
Every such behavior looks similar. What is really strange is that the last timestamp related to market sell is always the same as the first market buy. Assuming that those two orders are created by two different players - it is almost impossible that they know each other.
Market impact on those trades is more than average -> mean of the market impact of the market order is about 0.22 ticks (if we exclude all market orders without market impact - it is 1.39 ticks). Here we have more than 30 ticks on this market sell.
Read 4 tweets

Did Thread Reader help you today?

Support us! We are indie developers!


This site is made by just two indie developers on a laptop doing marketing, support and development! Read more about the story.

Become a Premium Member ($3/month or $30/year) and get exclusive features!

Become Premium

Don't want to be a Premium member but still want to support us?

Make a small donation by buying us coffee ($5) or help with server cost ($10)

Donate via Paypal

Or Donate anonymously using crypto!

Ethereum

0xfe58350B80634f60Fa6Dc149a72b4DFbc17D341E copy

Bitcoin

3ATGMxNzCUFzxpMCHL5sWSt4DVtS8UqXpi copy

Thank you for your support!

Follow Us on Twitter!

:(