Let's continue with the #TimeSeries forecasting 😀
We want to use an #ARIMA to forecast the #BTC price. But... how can we select its parameters?
#machinelearning #python #datascience
We want to use an #ARIMA to forecast the #BTC price. But... how can we select its parameters?
#machinelearning #python #datascience
Let's first start with "p" and "q".
For this, we need to check how correlated the time series is with lagged versions of itself.
The original time series will be denoted as 0. A 1-timestep lagged version will be referred to as 1. And so on...
For this, we need to check how correlated the time series is with lagged versions of itself.
The original time series will be denoted as 0. A 1-timestep lagged version will be referred to as 1. And so on...
The correlation of the original time series with the lag 0 (no lagged), will always be equal to 1, since they are the same time series.
The questions are...
• What is the correlation of the original time series with lag 1?
• What about lag 2?
• And 3, 4, 5...?
The questions are...
• What is the correlation of the original time series with lag 1?
• What about lag 2?
• And 3, 4, 5...?
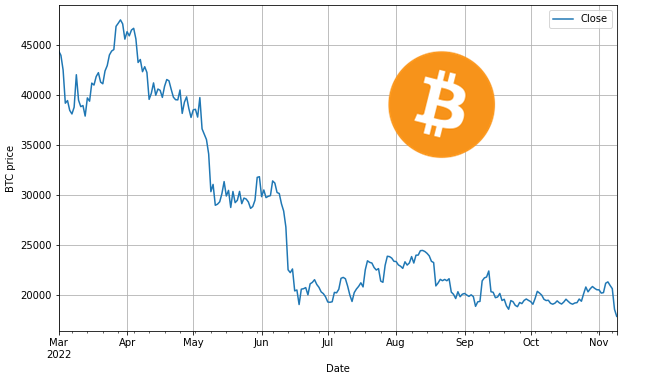
A timestep “t” will have some correlation with the previous one (t-1) just by being adjacent to it.
For example, with the #Bitcoin price, the price today will be influenced by the price it had yesterday. Also, the price yesterday will be affected by the price the day before.
For example, with the #Bitcoin price, the price today will be influenced by the price it had yesterday. Also, the price yesterday will be affected by the price the day before.
There are two effects that we need to account for:
1️⃣ The indirect effect that the timestep t-1, t-2, t-3… have over timestep t, just by being adjacent to one another. This is what we have just explained with the #BTC price.
1️⃣ The indirect effect that the timestep t-1, t-2, t-3… have over timestep t, just by being adjacent to one another. This is what we have just explained with the #BTC price.
2️⃣ The direct effect that each of the previous timesteps has over timestep t.
If for instance, every three days (for the #BTC example) there is a special event, it is expected that we will see a direct correlation of the time series with a lag 3 series.
If for instance, every three days (for the #BTC example) there is a special event, it is expected that we will see a direct correlation of the time series with a lag 3 series.
To measure these two effects we can use the ACF and PACF graphs:
· ACF (AutoCorrelation Function) shows the correlation between timesteps. It includes both direct and indirect effects.
· PACF (Partial AutoCorrelation Function) shows only the direct correlation.
· ACF (AutoCorrelation Function) shows the correlation between timesteps. It includes both direct and indirect effects.
· PACF (Partial AutoCorrelation Function) shows only the direct correlation.
We use the so-called "lollipop" graphs to visualise it.
There are several spikes or "lollipops" on it. They indicate the correlation of each lag (on the x-axis) with the original non-lagged time series.
There are several spikes or "lollipops" on it. They indicate the correlation of each lag (on the x-axis) with the original non-lagged time series.

We will pay attention to the largest spike closer to the lag 0 which is significantly different from 0 (out of the blue-shaded area).
But for today is enough. Tomorrow we will see how we select "p" and "q" for this example.
Follow me on @daansan_ml to find out 😉
But for today is enough. Tomorrow we will see how we select "p" and "q" for this example.
Follow me on @daansan_ml to find out 😉
If you don't know what those parameters are, check my previous tweet 👇
https://twitter.com/daansan_ml/status/1588226047626989568
• • •
Missing some Tweet in this thread? You can try to
force a refresh