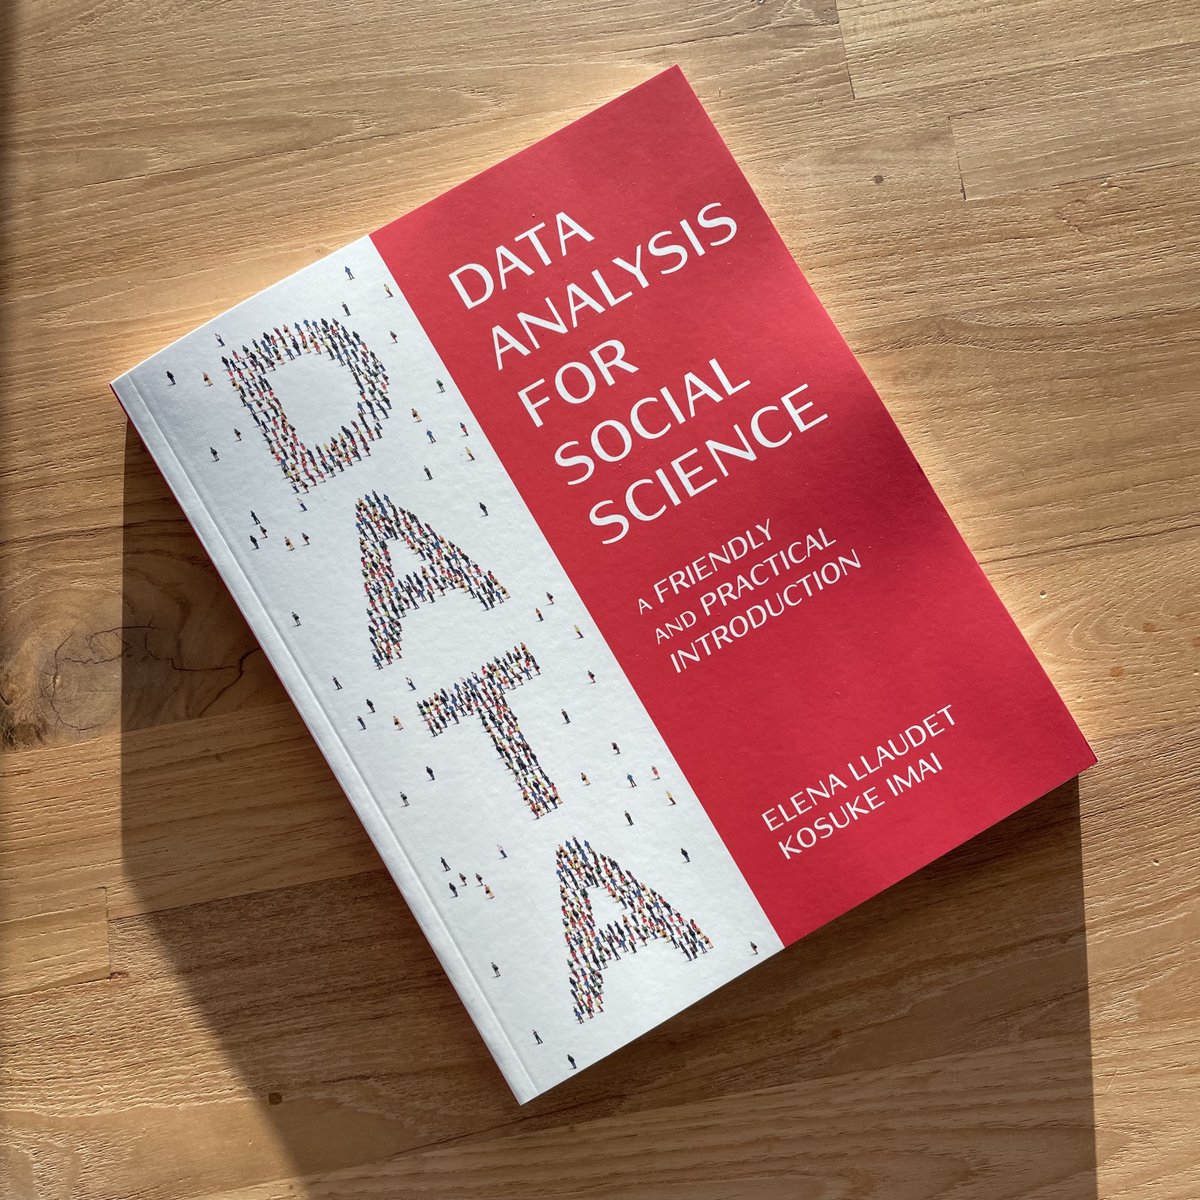
My textbook with Kosuke Imai (@Harvard) is finally out!
Assuming no prior knowledge of statistics or coding and only minimal knowledge of math, DSS teaches the fundamentals of survey research, predictive models, and causal inference + how to analyze real-world data with R.
🧵..
Assuming no prior knowledge of statistics or coding and only minimal knowledge of math, DSS teaches the fundamentals of survey research, predictive models, and causal inference + how to analyze real-world data with R.
🧵..

1/n: DSS is meant for complete beginners, regardless of whether they are in high school, in graduate school, or out of school altogether. #rstats #surveys #prediction #causality
Want to see for yourself? The first chapter is free here: bit.ly/dss_preview
Book outline:
Want to see for yourself? The first chapter is free here: bit.ly/dss_preview
Book outline:

2/n: We wrote DSS so that anyone could learn the skills we teach by following along with the exercises in the book on their own computer, without the help of an instructor. (Everything needed is either in the book or on the book's website.) #rstats #surveys #prediction #causality 

3/n: DSS provides a step-by-step guide to analyzing real-world data from published research with the free and popular statistical program R. The datasets and the code used to analyze them are provided on the book’s website. #rstats #surveys #prediction #causality 

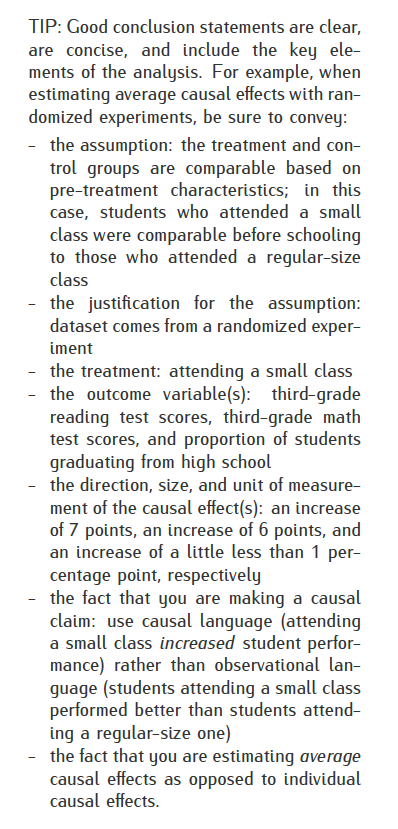
4/n: We intentionally designed DSS to accommodate different audiences. We included TIPs with supplemental material and placed relatively math-heavy material in sections labeled FORMULA IN DETAIL, which readers can choose to read or skip. #rstats #surveys #prediction #causality 


5/n: Since DSS is designed to accommodate different audiences, it is suitable for courses at different levels of schooling. Indeed, DSS has already been used to teach introductory quant methods in high schools, grad programs, and everything in between. #rstats #AcademicTwitter
6/n: To help instructors teaching this material for the first time, DSS comes with course materials such as sample syllabus, lecture slides, in-class exercises, additional real-world datasets, and additional exercises with solutions. #AcademicTwitter #AcademicChatter 


7/n: Instructors: Request your exam copy of DSS here: bit.ly/dss_desk_copy, and access to course materials here: bit.ly/dss_instructor…
Here is the syllabus of my undergraduate course: dropbox.com/s/aagv7cpsbaha…
#rstats #surveys #prediction #causality #AcademicTwitter
Here is the syllabus of my undergraduate course: dropbox.com/s/aagv7cpsbaha…
#rstats #surveys #prediction #causality #AcademicTwitter
8/n: To help readers review material, in DSS, we included CHEATSHEETS of statistical concepts and of R code. And, throughout the book, we included in the margins RECALLs with relevant information mentioned earlier in the book. #rstats #surveys #prediction #causality 


9/n: In chapter 1, we start from the very beginning by familiarizing ourselves with RStudio and R and learning to load and make sense of data. #rstats #learnbydoing 

10/n: In chapter 2, we learn what causal effects are and how to estimate them using randomized experiments. We analyze data from Project STAR to answer: What is the effect of small classes on student performance? #causality #experiments 

11/n: In chapter 3, we learn about surveys and how to visualize and summarize the distribution of single variables as well as the relationship between two. We analyze data on the 2016 British referendum to answer: Who Supported Brexit? #surveys #descriptivestatistics #correlation 

12/n: In chapter 4, we learn how to predict outcomes using simple linear regression models. We analyze data from 170 countries to predict GDP growth using night-time light emissions as measured from space. #linearmodel #prediction 

13/n: In chapter 5, we learn how to estimate causal effects using observational data by controlling for confounders with multiple linear regression models. We answer: What was the effect of Russian TV propaganda on the 2014 Ukrainian elections? #causality #observationaldata #DAGs 

14/n: In chapter 6, we cover basic probability. We learn about random variables and their distributions, the distinction between population parameters and sample statistics, and the two large sample theorems that enable us to measure statistical uncertainty. #probability 

15/n: In chapter 7, we learn how to quantify the uncertainty in our empirical findings in order to draw conclusions at the population level. We complete some of the analyses we started in chapters 2 through 5. #uncertainty 

16/n: Whenever a new core concept is introduced, in the margin you will find its definition repeated (displayed in red). Whenever a new piece of R code is introduced, in the margin you will find a brief overview of how it works with an example (displayed in a cyan-colored frame). 


17/n: We also tried to make the price of DSS accessible.
The ebook can be rented for three months for less than $15 on Amazon: amzn.to/3eXMI7S, and for six months for $21 on RedShelf: bit.ly/dss_redshelf.
The paperback costs $45: bit.ly/dss_pb
The ebook can be rented for three months for less than $15 on Amazon: amzn.to/3eXMI7S, and for six months for $21 on RedShelf: bit.ly/dss_redshelf.
The paperback costs $45: bit.ly/dss_pb
18/n: It took us more than five years to write and produce this book.😅
We are thrilled it is finally out and we sincerely hope it is helpful to you! Please let us know if you like it.
- Elena and Kosuke

We are thrilled it is finally out and we sincerely hope it is helpful to you! Please let us know if you like it.
- Elena and Kosuke


• • •
Missing some Tweet in this thread? You can try to
force a refresh


