
Below is a MEGA thread containing the 100 greatest winners from 1880-2009 📈
LIKE 👍 & RETWEET 🔄 to spread the wealth of knowledge💸
Charts are sourced from none other than the GOAT William O'Neil's "How to Make Money in Stocks"
But first, why do these charts matter?
👇
LIKE 👍 & RETWEET 🔄 to spread the wealth of knowledge💸
Charts are sourced from none other than the GOAT William O'Neil's "How to Make Money in Stocks"
But first, why do these charts matter?
👇
They go back to 1880. This shows the timeless principles that we are using here. It is the law of supply and demand. These patterns work because they are the effect of institutional demand, not the cause.
This strategy is RESILIENT
This strategy is RESILIENT
If your goal is to identify stocks with big potential, you need to know what will drive prices up. Institutional demand is what moves prices. They are are the biggest buyers (and sellers) in the market. They want growth in earnings, sales and margins.
As WON says
"It is the unique combination of your finding stocks with big increases in sales, earnings and ROE + strong chart patterns revealing institutional buying that together will materially improve your stock selection and timing. The best pros use charts"
Now, LET'S GO!
"It is the unique combination of your finding stocks with big increases in sales, earnings and ROE + strong chart patterns revealing institutional buying that together will materially improve your stock selection and timing. The best pros use charts"
Now, LET'S GO!
Richmond & Danville – 1885
Increased 257% in 70 weeks
Increased 257% in 70 weeks

Tennessee Coal – 1898
Increased 265% in 39 weeks
Increased 265% in 39 weeks

Northern Pacific – 1900
Increased 1,181% in 29 weeks
Increased 1,181% in 29 weeks

Bethlehem Steel – 1914
Increased 1,479% in 99 weeks
Increased 1,479% in 99 weeks

General Motors – 1915
Increased 471% in 39 weeks
Increased 471% in 39 weeks

S.S. Kresge – 1923
Increased 836% in 154 weeks
Increased 836% in 154 weeks

Utah Securities – 1924
Increased 538% in 63 weeks
Increased 538% in 63 weeks

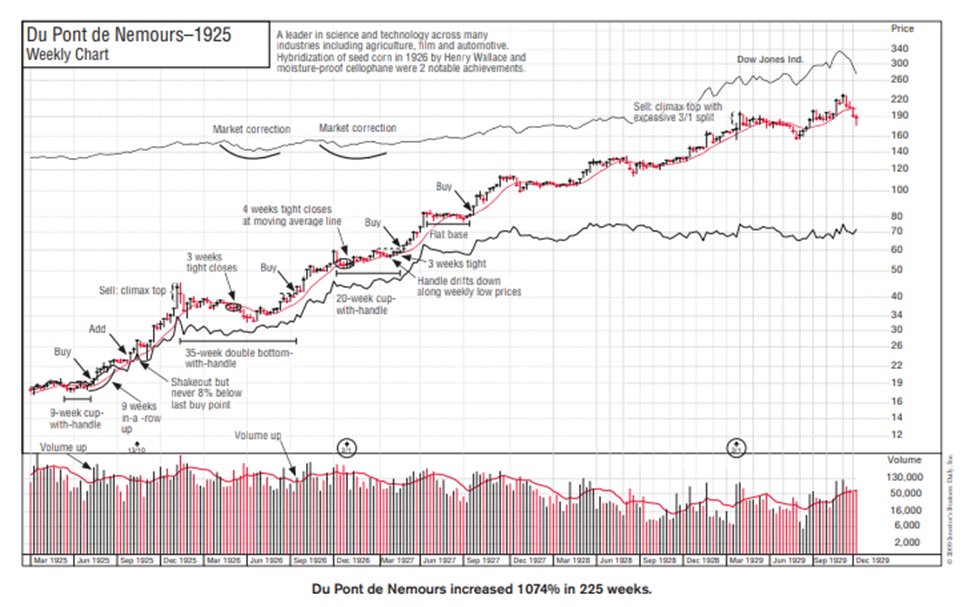
Du Pont de Nemours – 1925
Increased 1,074% in 225 weeks
Increased 1,074% in 225 weeks
Burroughs Adding Machines – 1926
Increased 1,992% in 168 weeks
Increased 1,992% in 168 weeks

Intl. Business Machines – 1926
Increased 400% in 161 weeks
Increased 400% in 161 weeks

Wright Aeronautical – 1927
Increased 464% in 76 weeks
Increased 464% in 76 weeks

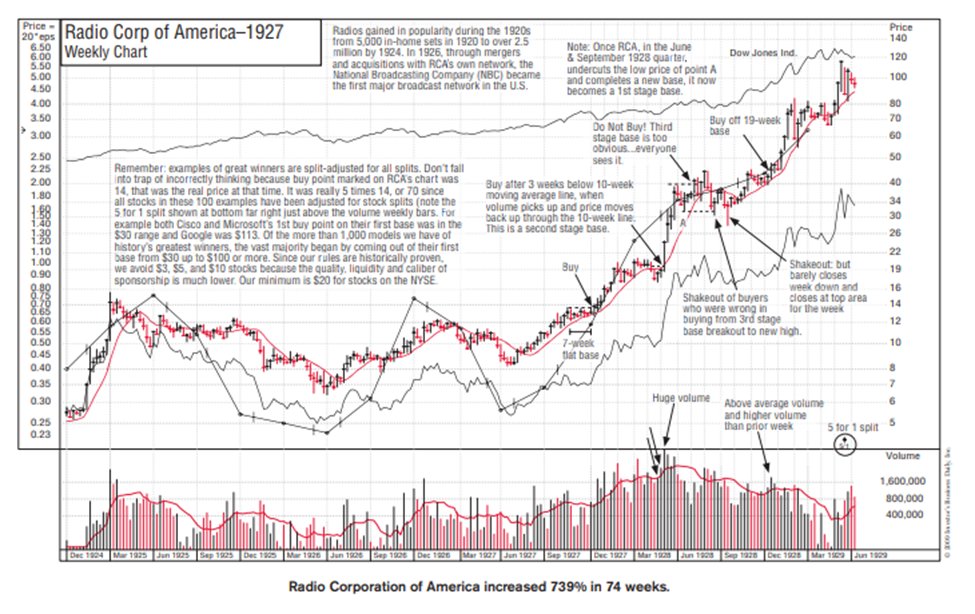
Radio Corp of America – 1927
Increased 739% in 74 weeks
Increased 739% in 74 weeks
Minneapolis-Honeywell Regulator – 1933
Increased 987% in 170 weeks
Increased 987% in 170 weeks

Coca-Cola – 1934
Increased 565% in 165 weeks
Increased 565% in 165 weeks

Deere & Co – 1935
Increased 307% in 104 weeks
Increased 307% in 104 weeks

Schenley Distilling – 1943
Increased 1,164% in 185 weeks
Increased 1,164% in 185 weeks

Condé Nast Publications – 1944
Increased 514% in 101 weeks
Increased 514% in 101 weeks

Gimbel Bros. – 1944
Increased 674% in 103 weeks
Increased 674% in 103 weeks

Outboard Marine – 1954
Increased 720% in 177 weeks
Increased 720% in 177 weeks

Kaiser Aluminum – 1954
Increased 379% in 93 weeks
Increased 379% in 93 weeks

Thiokol Chemical – 1957
Increased 860% in 109 weeks
Increased 860% in 109 weeks

Brunswick – 1958
Increased 1,500% in 162 weeks
Increased 1,500% in 162 weeks

Zenith Radio – 1958
Increased 493% in 66 weeks
Increased 493% in 66 weeks

Texas Instruments – 1958
Increased 772% in 116 weeks
Increased 772% in 116 weeks

Universal Controls – 1958
Increased 645% in 51 weeks
Increased 645% in 51 weeks

Xerox – 1958
Increased 1,201% in 188 weeks
Increased 1,201% in 188 weeks

American Photocopy Equip. – 1958
Increased 696% in 133 weeks
Increased 696% in 133 weeks

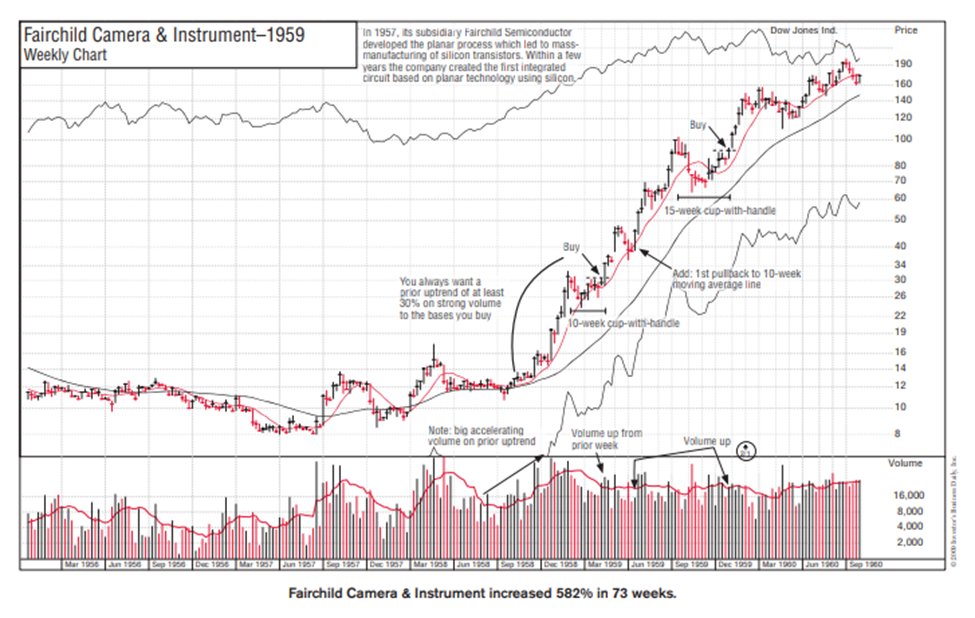
Fairchild Camera & Instrument – 1959
Increased 582% in 73 weeks
Increased 582% in 73 weeks
Chrysler – 1962
Increased 251% in 51 weeks
Increased 251% in 51 weeks

National Airlines – 1962
Increased 1,004% in 179 weeks
Increased 1,004% in 179 weeks

Northwest Airlines – 1962
Increased 1,240% in 186 weeks
Increased 1,240% in 186 weeks

Xerox – 1963
Increased 660% in 168 weeks
Increased 660% in 168 weeks

Syntex – 1963
Increased 451% in 25 weeks
Increased 451% in 25 weeks

Rollins – 1964
Increased 254% in 36 weeks
Increased 254% in 36 weeks

Simmonds Precision – 1965
Increased 672% in 38 weeks
Increased 672% in 38 weeks

Monogram Industries – 1966
Increased 891% in 57 weeks
Increased 891% in 57 weeks

Digital Equipment – 1967
Increased 743% in 156 weeks
Increased 743% in 156 weeks

Loews – 1967
Increased 1,025% in 101 weeks
Increased 1,025% in 101 weeks

Mattel – 1967
Increased 441% in 66 weeks
Increased 441% in 66 weeks

Skyline – 1967
Increased 715% in 98 weeks
Increased 715% in 98 weeks

Redman Industries – 1968
Increased 683% in 49 weeks
Increased 683% in 49 weeks

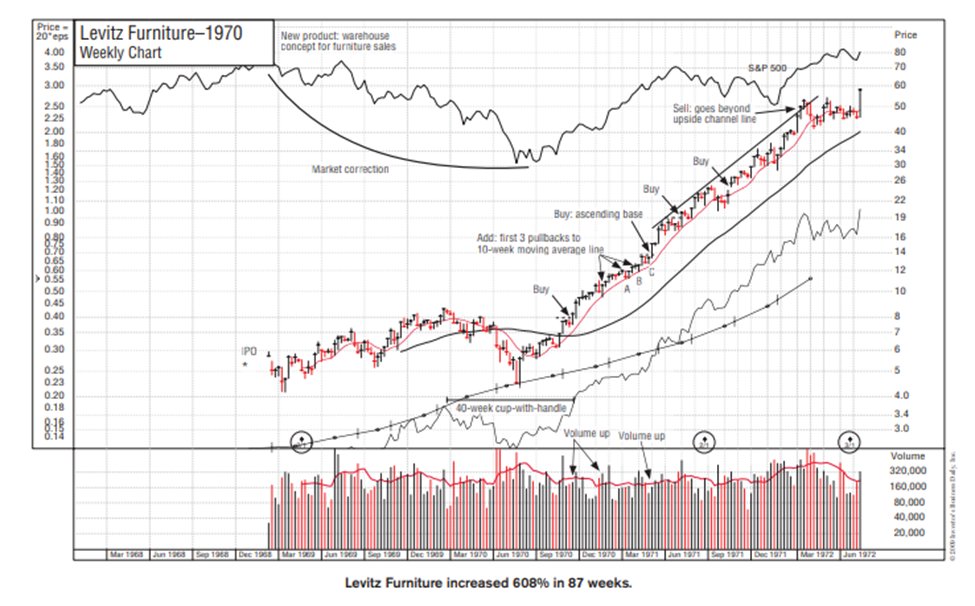
Levitz Furniture – 1970
Increased 608% in 87 weeks
Increased 608% in 87 weeks
Rite Aid – 1970
Increased 421% in 71 weeks
Increased 421% in 71 weeks

McDonalds – 1970
Increased 422% in 108 weeks
Increased 422% in 108 weeks

Sambos Restaurants – 1971
Increased 458% in 104 weeks
Increased 458% in 104 weeks

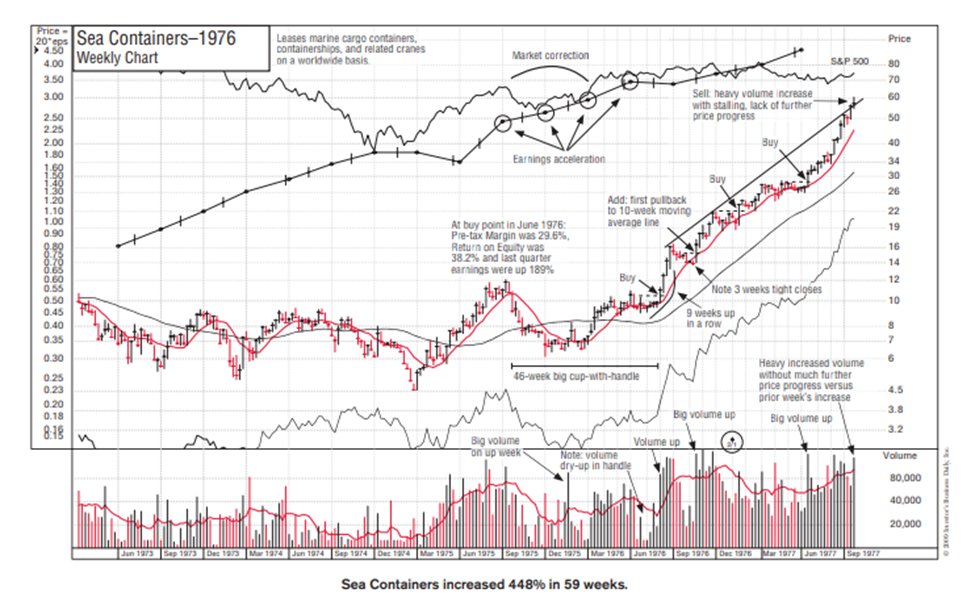
Sea Containers – 1976
Increased 448% in 59 weeks
Increased 448% in 59 weeks
Flightsafety Intl. – 1977
Increased 958% in 195 weeks
Increased 958% in 195 weeks

Wang Labs – 1978
Increased 1,348% in 139 weeks
Increased 1,348% in 139 weeks

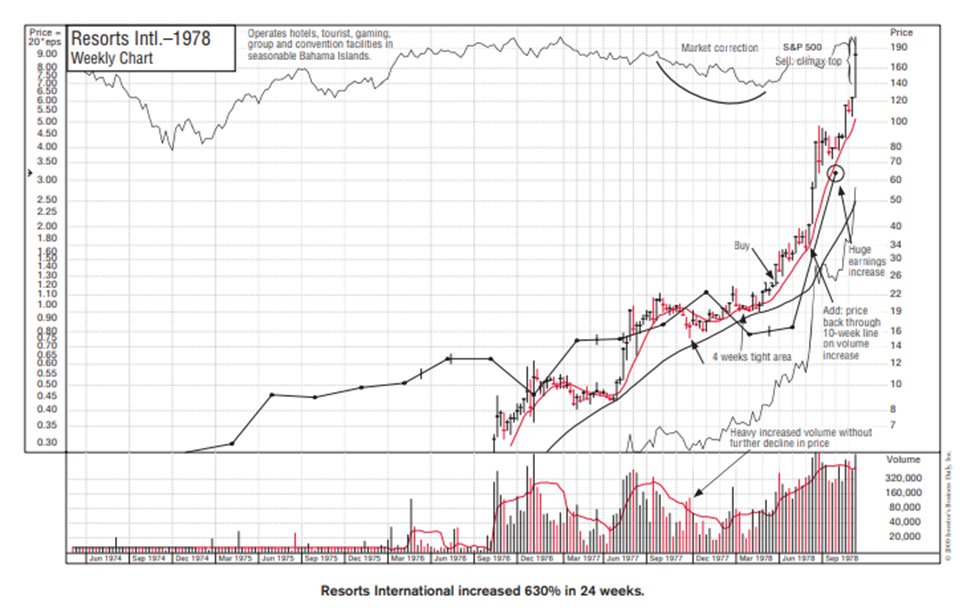
Resorts International – 1978
Increased 630% in 24 weeks
Increased 630% in 24 weeks
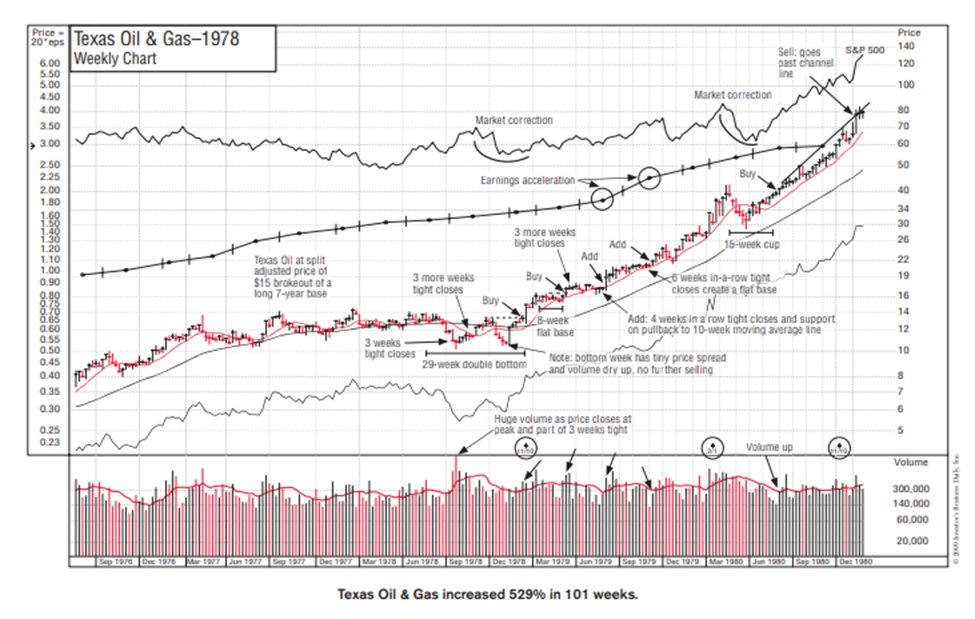
Texas Oil & Gas – 1978
Increased 529% in 101 weeks
Increased 529% in 101 weeks
Global Marine – 1979
Increased 752% in 94 weeks
Increased 752% in 94 weeks

Pic ’N’ Save – 1979
Increased 546% in 206 weeks
Increased 546% in 206 weeks

Wal-Mart – 1980
Increased 882% in 158 weeks
Increased 882% in 158 weeks

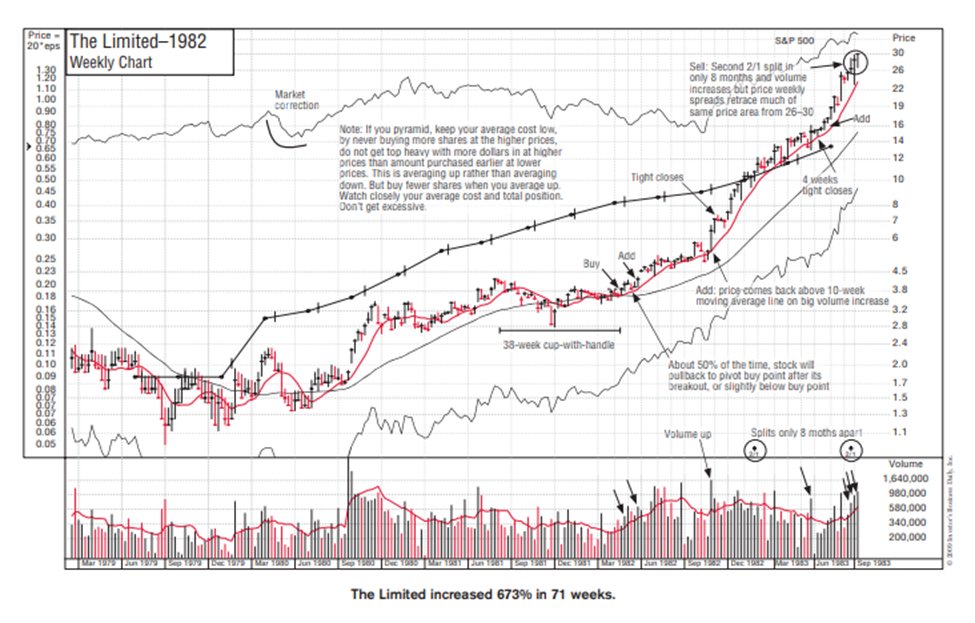
The Limited – 1982
Increased 673% in 71 weeks
Increased 673% in 71 weeks
Home Depot – 1982
Increased 892% in 64 weeks
Increased 892% in 64 weeks

Price Co – 1982
Increased 417% in 60 weeks
Increased 417% in 60 weeks

Stop & Shop – 1982
Increased 536% in 74 weeks
Increased 536% in 74 weeks

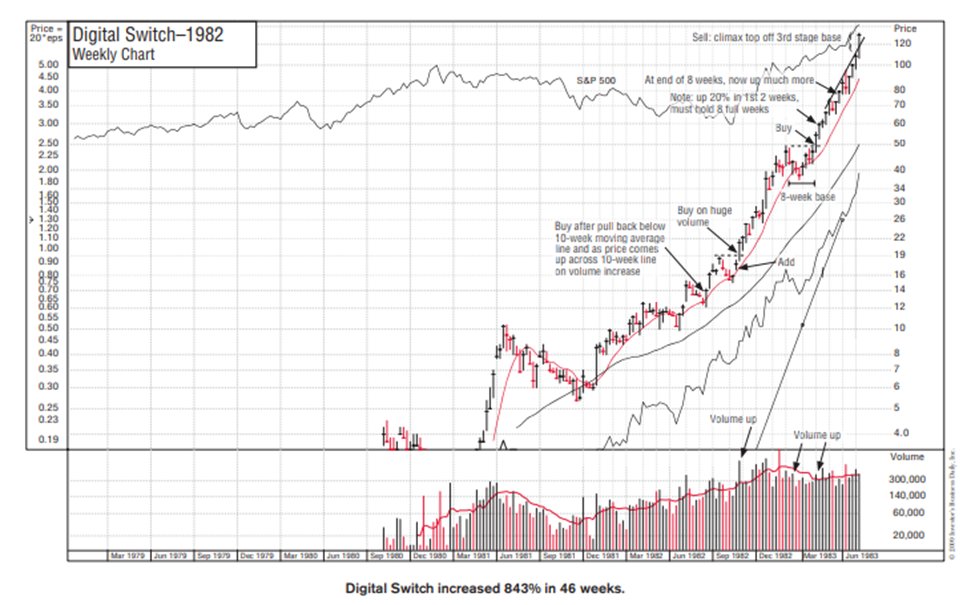
Digital Switch – 1982
Increased 843% in 46 weeks
Increased 843% in 46 weeks
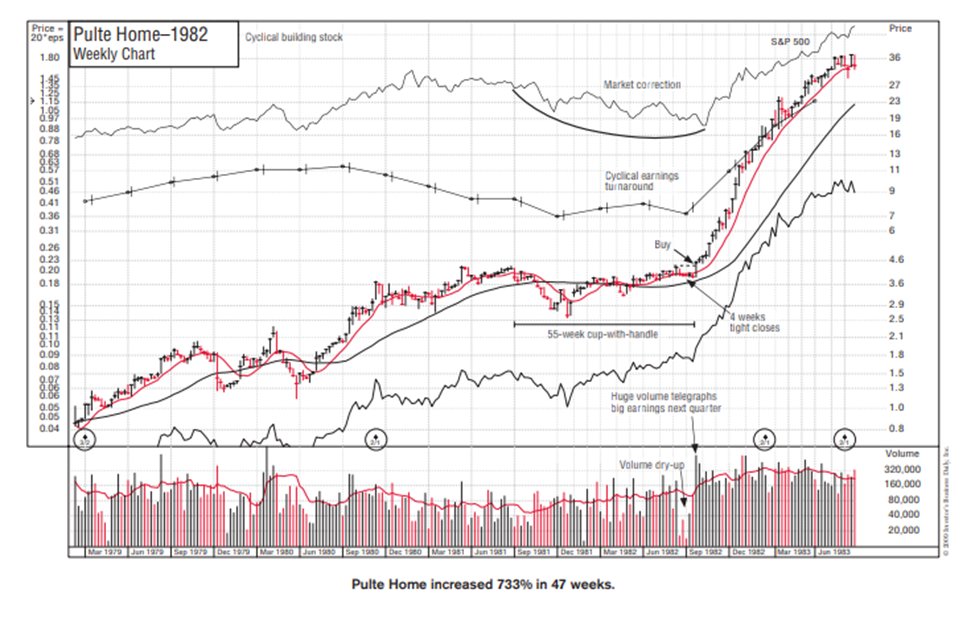
Pulte Home – 1982
Increased 733% in 47 weeks
Increased 733% in 47 weeks
Liz Claiborne – 1982
Increased 211% in 43 weeks
Increased 211% in 43 weeks

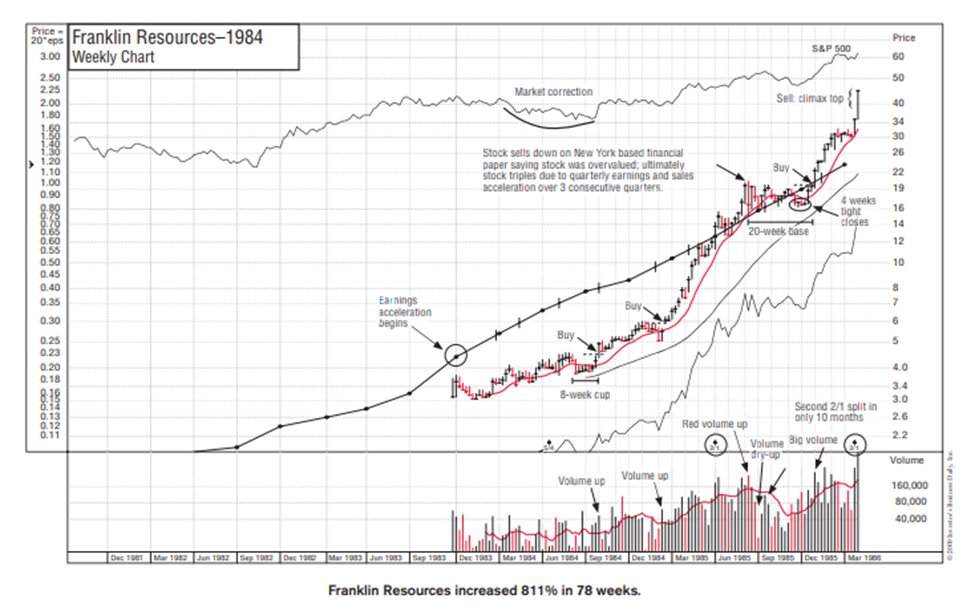
Franklin Resources – 1984
Increased 811% in 78 weeks
Increased 811% in 78 weeks
Microsoft – 1986
Increased 272% in 30 weeks
Increased 272% in 30 weeks

Adobe Systems – 1986
Increased 307% in 23 weeks
Increased 307% in 23 weeks

Costco Wholesale – 1988
Increased 712% in 163 weeks
Increased 712% in 163 weeks

Microsoft – 1989
Increased 517% in 121 weeks
Increased 517% in 121 weeks

American Power Conversion – 1990
Increased 745% in 96 weeks
Increased 745% in 96 weeks

Amgen – 1990
Increased 681% in 96 weeks
Increased 681% in 96 weeks

United States Surgical – 1990
Increased 786% in 93 weeks
Increased 786% in 93 weeks

Healthcare Compare – 1990
Increased 540% in 61 weeks
Increased 540% in 61 weeks

Cisco Systems – 1990
Increased 1,602% in 169 weeks
Increased 1,602% in 169 weeks

Newbridge Networks – 1992
Increased 699% in 49 weeks
Increased 699% in 49 weeks

E M C – 1992
Increased 471% in 56 weeks
Increased 471% in 56 weeks

Gartner Group – 1994
Increased 667% in 98 weeks
Increased 667% in 98 weeks

Peoplesoft – 1994
Increased 1,145% in 129 weeks
Increased 1,145% in 129 weeks

Alliance Semiconductor – 1994
Increased 539% in 47 weeks
Increased 539% in 47 weeks

America Online – 1994
Increased 570% in 75 weeks
Increased 570% in 75 weeks

Ascend Communications – 1994
Increased 1,384% in 75 weeks
Increased 1,384% in 75 weeks

Accustaff – 1995
Increased 1,359% in 68 weeks
Increased 1,359% in 68 weeks

J L G Industries – 1995
Increased 670% in 53 weeks
Increased 670% in 53 weeks

Dell Computer – 1996
Increased 587% in 61 weeks
Increased 587% in 61 weeks

Yahoo! – 1997
Increased 6,723% in 130 weeks
Increased 6,723% in 130 weeks

Charles Schwab – 1998
Increased 409% in 26 weeks
Increased 409% in 26 weeks

America Online – 1998
Increased 451% in 23 weeks
Increased 451% in 23 weeks

J D S Uniphase – 1998
Increased 1,946% in 66 weeks
Increased 1,946% in 66 weeks

Qualcomm – 1999
Increased 2,091% in 45 weeks
Increased 2,091% in 45 weeks

Taro Pharmaceutical – 2000
Increased 382% in 39 weeks
Increased 382% in 39 weeks

eBay – 2002
Increased 282% in 115%
Increased 282% in 115%

Deckers Outdoor – 2003
Increased 766% in 88 weeks
Increased 766% in 88 weeks

T A S E R Intl. – 2003
Increased 2,228% in 39 weeks
Increased 2,228% in 39 weeks

Apple – 2004
Increased 1,418% in 199 weeks
Increased 1,418% in 199 weeks

Southwestern Energy – 2004
Increased 556% in 83 weeks
Increased 556% in 83 weeks

C B Richard Ellis – 2004
Increased 538% in 149 weeks
Increased 538% in 149 weeks

Google – 2004
Increased 536% in 164 weeks
Increased 536% in 164 weeks

Hansen Natural – 2004
Increased 1,219% in 86 weeks
Increased 1,219% in 86 weeks

Titanium Metals – 2005
Increased 764% in 49 weeks
Increased 764% in 49 weeks

Precision Castparts – 2005
Increased 259% in 115 weeks
Increased 259% in 115 weeks

Intuitive Surgical – 2005
Increased 418% in 123 weeks
Increased 418% in 123 weeks


First Solar – 2007
Increased 807% in 47 weeks
Increased 807% in 47 weeks

Mosaic – 2007
Increased 265% in 40 weeks
Increased 265% in 40 weeks

$STUDY these charts endlessly
They are the key to developing an experts edge in the market
If you enjoyed this thread, like and retweet the first tweet in this thread (if you can find it 🤣)
And consider purchasing my model book 💸
michaelwalstedt.gumroad.com/l/modelbook
They are the key to developing an experts edge in the market
If you enjoyed this thread, like and retweet the first tweet in this thread (if you can find it 🤣)
And consider purchasing my model book 💸
michaelwalstedt.gumroad.com/l/modelbook
My trading pursuit is inspired by many
@markminervini
@MarkRitchie_II
@HonuMgmt
@RichardMoglen
@RoyLMattox
@RyanPierpont
@dryan310
and many more!
@markminervini
@MarkRitchie_II
@HonuMgmt
@RichardMoglen
@RoyLMattox
@RyanPierpont
@dryan310
and many more!
$SPY $QQQ $IWM $AAPL $TSLA $FSLR $ENPH $TLT $WMT $TGT $AMZN $BTC $ETH $CELH $MSFT $AMD $COIN $NVDA $COST $QCOM $EBAY $META $GOOGL $RBLX #fed #inflation #pivot #FOMC #rates #trading #daytrading #HTMMIS #VCP
END THREAD
END THREAD
More include
@SSalim0002
@mardermarket
@AsennaWealth
@TradingComposur
@traderCharlieM
@Trader_mcaruso
@SSalim0002
@mardermarket
@AsennaWealth
@TradingComposur
@traderCharlieM
@Trader_mcaruso
• • •
Missing some Tweet in this thread? You can try to
force a refresh


