THREAD 👇👇👇
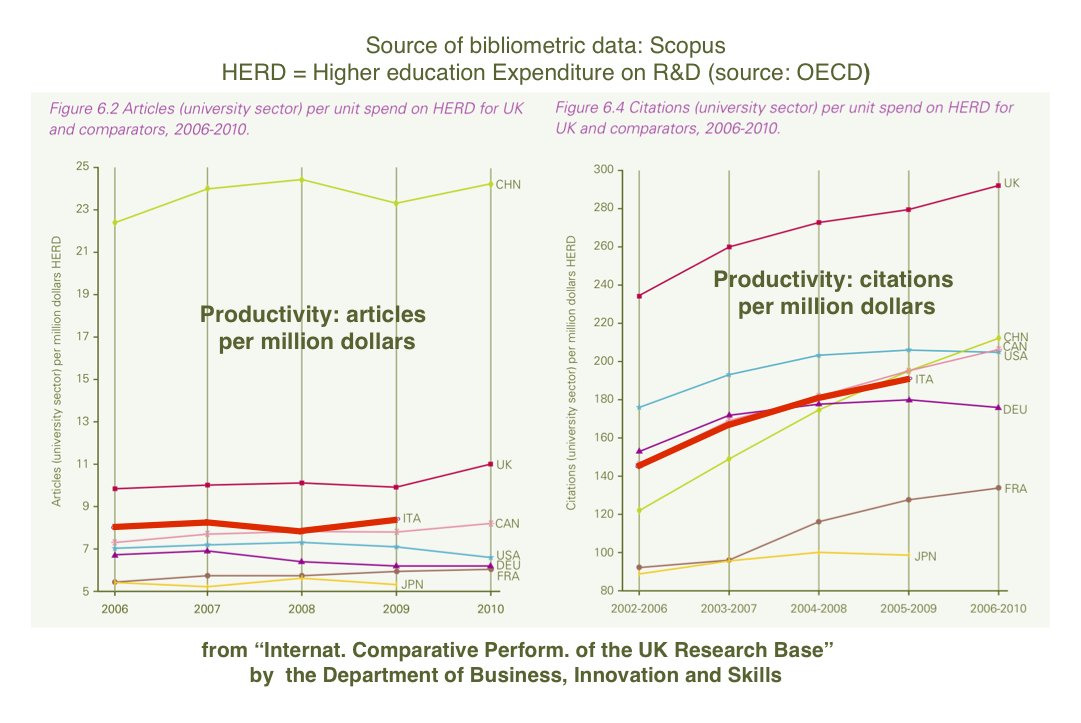
#Funnelplots: a cheap, graphically insightful and rigorous tool for early detection of #COVID19 variants. What are funnel plots? Their link with statistical quality control. Their previous uses in health care. rdcu.be/c3LNc @SpringerNature @SciReports 1/N
#Funnelplots: a cheap, graphically insightful and rigorous tool for early detection of #COVID19 variants. What are funnel plots? Their link with statistical quality control. Their previous uses in health care. rdcu.be/c3LNc @SpringerNature @SciReports 1/N

The introduction of funnel plots in healthcare surveillance dates back to the early 2000s when in UK the Shipman case and the Bristol Heart scandal triggered the development of statistical methods for monitoring healthcare institutions. 2/N

In the first decade of the 2000's several contributions supported performance monitoring by control charts, a tool borrowed from Statistical Quality Control (developed by W.A. Shewart in the 1920's). 3/N
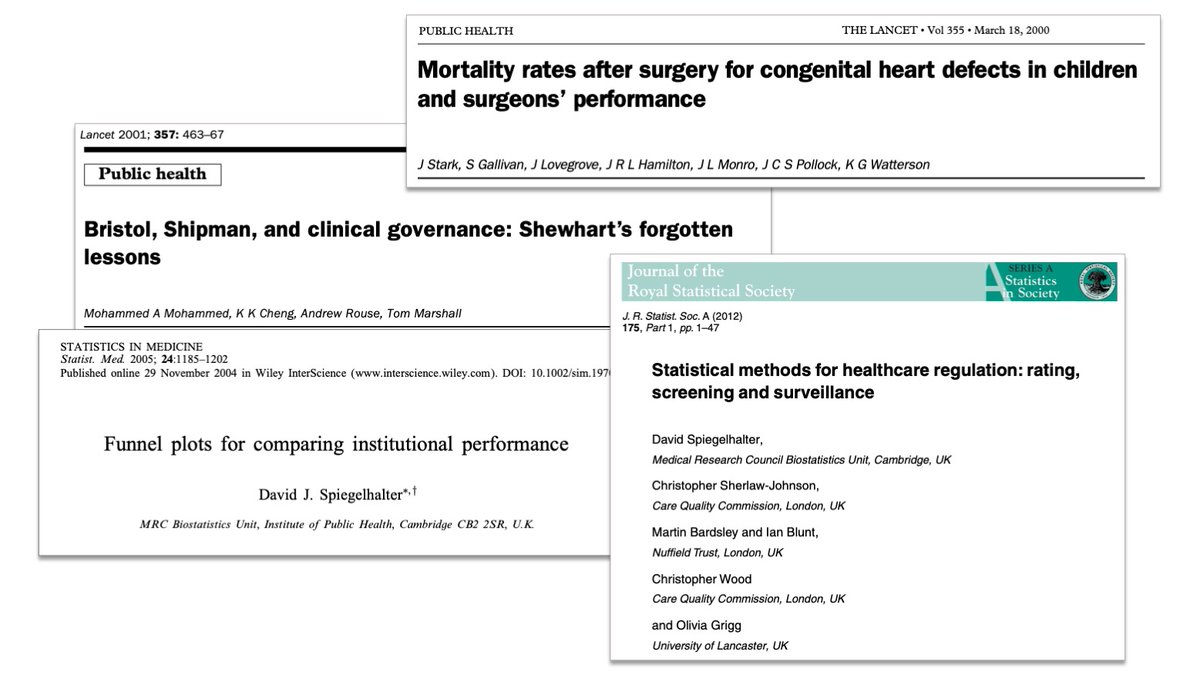
In particular, @d_spiegel promoted the use of "funnel plots", so called from their shape. Among their advantages: intuitive choice of axes and hence easy plotting, and exact control limits. doi.org/10.1002/sim.19… 4/N

Why are they useful? Because they help detecting significant events from random variation. An example: in 2011, the BBC raised the alarm: "There is a big variation across the UK in the number of people who die from bowel cancer". bbc.com/news/health-14… 5/N

By plotting mortality data on a funnel plot, it could be seen that "bowel cancer variation" was almost all due to chance, with just a few districts lying outside the alarm limits. pb204.blogspot.com/2011/09/three-… 6/N

What do funnel plots have to do with #COVID19 variants? Actually, in absence of strains with transmission advantages, if you plot the regional Rt's against the number of infectious cases, you get a funnel plot! 7/N

What happens when some region hosts a new variant having a transmission advantage? The corresponding Rt will grow and it will cross the upper alarm limit of the funnel. This was the case of Lombardia when #Omicron first arrived in #Italy. 8/N

In absence of transmission advantage, points form a funnel that is disrupted when a new variant start colonizing one region. When all regions are colonized, the regional Rt's converge to a new funnel, higher and wider than the initial one. 9/N

Funnel plots can detect the onset of a new variant from the crossing of alarm limits. Let's see the evolution of the funnel plots of Indian regional Rt's during February 2021, when #Delta arose in the #Maharashtra state of #India. 10/N

To trigger an alarm, funnel plots have to wait for the anomalous increase of a regional Rt due to colonization by the new strain. Does this affect the timeliness of the alarm? It seems not. 11/N

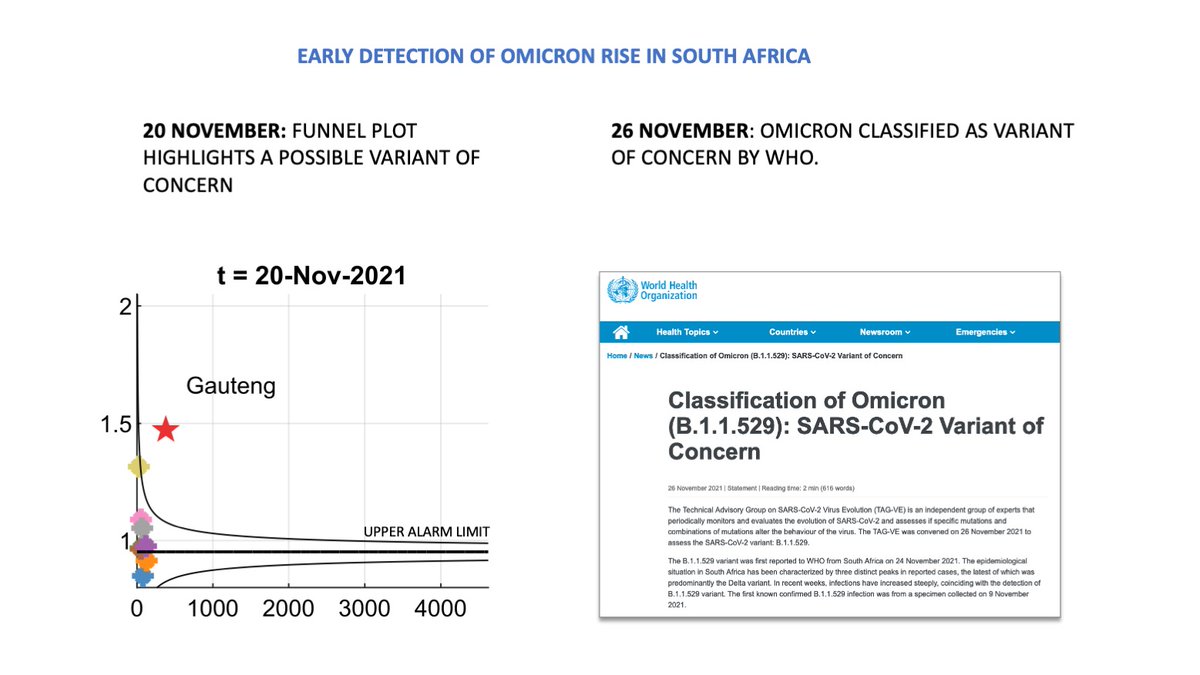
Could a funnel plot detect also the onset of #Omicron? Let's have a look at the funnel plots during November 2021, when Omicron rose in the #Gauteng province of #SouthAfrica. Again, the plot detects an anomalous Rt in that province. 12/N

Concerning timeliness, the funnel plot alarm anticipates by a few days the classification of Omicron as variant of concern issued by #WHO. 13/N
In December 2021, #Omicron arrived in #England. In early December, the funnel plot highlights an anomalous Rt in the #London region. 14/N

Concerning timeliness of the alarm, also in this case the funnel alarm is triggered before #Omicron becomes the dominant variant in the #London region. 15/N

What about the lower alarm limit? Its crossing may signal a different kind of problem, as happened in South West England in the first half of September 2021, when the anomaly was due to a malfunctioning of a large testing lab. 16/N

The funnel plot could detect an anomaly in mid September. After more than one month (and tens of thousands of false negative tests), a scandal broke out and testing was suspended in a Wolverhampton Covid test lab. bbc.co.uk/news/health-54… 17/N

Funnel movies: If you plot funnel plots in sequence, the regional Rt's move like a flock along clockwise trajectories. Next, we show funnel movies for India (Delta), South Africa (Omicron), Italy (Omicron) and for England during 18 months. 18/N

India: funnel movie covering the period 13 February–5 March 2021, when the Delta variant emerged and started spreading from the state of #Maharashtra. 19/N
#SouthAfrica: funnel movie covering the period from 7 November to 4 December 2021, when the #Omicron variant colonized South Africa, starting with the province of #Gauteng. 20/N
#Italy: funnel movie covering the period from 4 December to 3 January 2022, when the #Omicron variant started to spread across the country. 21/N
#England: funnel movie for the nine English regions during 18 months, from the end of November 2020 to the beginning of June 2022. 22/N
Conclusion: funnel plots are a powerful and visually intuitive tool for early detection of variants. Because they are based only on regional Rt, they can identify emerging threats at no cost, so as to optimize expensive genomic sequencing efforts. rdcu.be/c3LNc N/N

@threadreaderapp please unroll
• • •
Missing some Tweet in this thread? You can try to
force a refresh