INTERPRETING THE CPI NOWCAST & how it works - a 🧵:
I, like many, have seen the rise in the CPI Nowcast over the last month & used it as a basis for expectations for Tuesday's #CPI release.
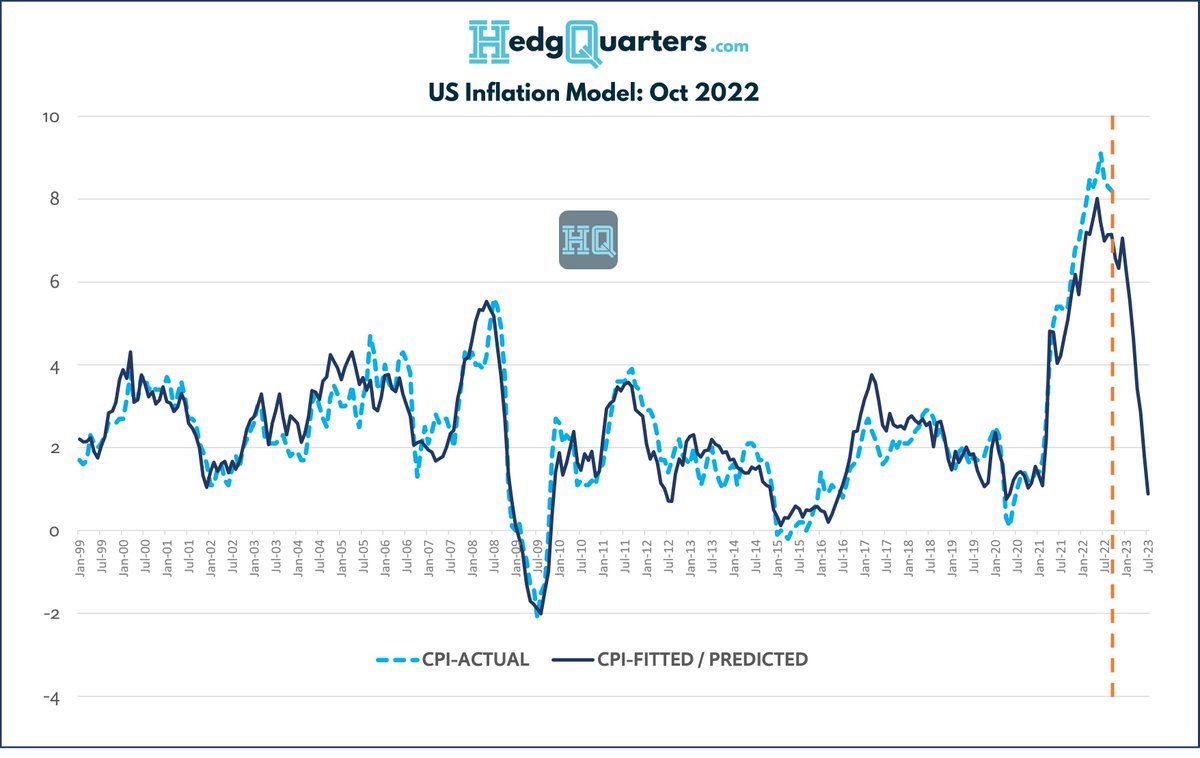
But how accurate is it at times like these. See chart:
#macro #inflation $SPY $QQQ #SPX
I, like many, have seen the rise in the CPI Nowcast over the last month & used it as a basis for expectations for Tuesday's #CPI release.
But how accurate is it at times like these. See chart:
#macro #inflation $SPY $QQQ #SPX

2/ The chart shows that as inflation rose, the Nowcast underestimated it and as it falls, theres been overestimation. Why?
Well the CPI Nowcast is based on an econometric model specified here: clefed.org/40Um5DE
I summarize how it works below and draw conclusions
Well the CPI Nowcast is based on an econometric model specified here: clefed.org/40Um5DE
I summarize how it works below and draw conclusions
3/ The Nowcast is computed from 3 core inputs, each of which is based on its own estimation process:
1. Core CPI Nowcast
2. Food CPI Nowcast
3. Gasoline CPI Nowcast
In simple terms, Core & Food are actually based on moving averages from the past 12 months of data...
1. Core CPI Nowcast
2. Food CPI Nowcast
3. Gasoline CPI Nowcast
In simple terms, Core & Food are actually based on moving averages from the past 12 months of data...

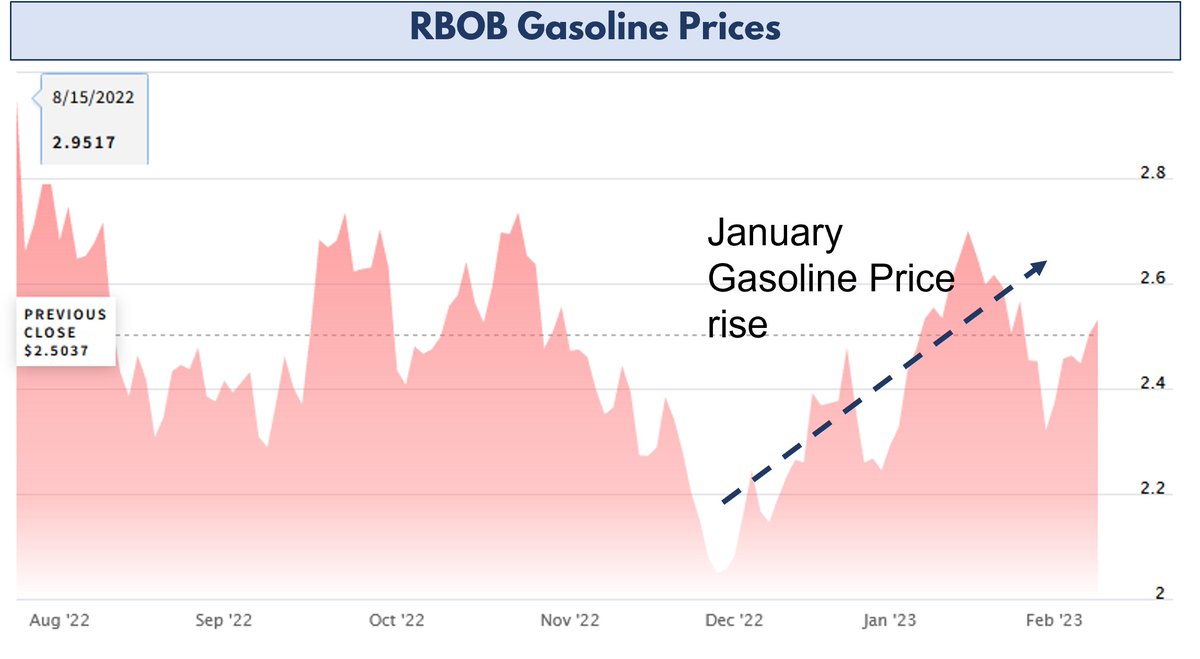
4/ Gasoline however uses a combination of updated weekly Gas price data from an input feed plus a forecast estimation based on a regression between gasoline and daily oil prices
Basically, Gasoline, is the only input into the NowCast that is (somewhat) forward looking as opposed
Basically, Gasoline, is the only input into the NowCast that is (somewhat) forward looking as opposed
5/ the other terms, which due to the use of moving averages can be lagged.
So thats why we see the NowCast typically underestimating CPI as inflation rises and an overestimation in periods like recently where inflation is falling.
So what about this month?
So thats why we see the NowCast typically underestimating CPI as inflation rises and an overestimation in periods like recently where inflation is falling.
So what about this month?
6/ Well Jan has two conflicting forces that make its reliability uncertain:
A. Gas prices rose over Jan, which is why the NowCast shows a MoM step up (to 0.65) from December's CPI release (0.1)
Gas also gets seasonally adj in the model whereas the observed price is not
A. Gas prices rose over Jan, which is why the NowCast shows a MoM step up (to 0.65) from December's CPI release (0.1)
Gas also gets seasonally adj in the model whereas the observed price is not
7/
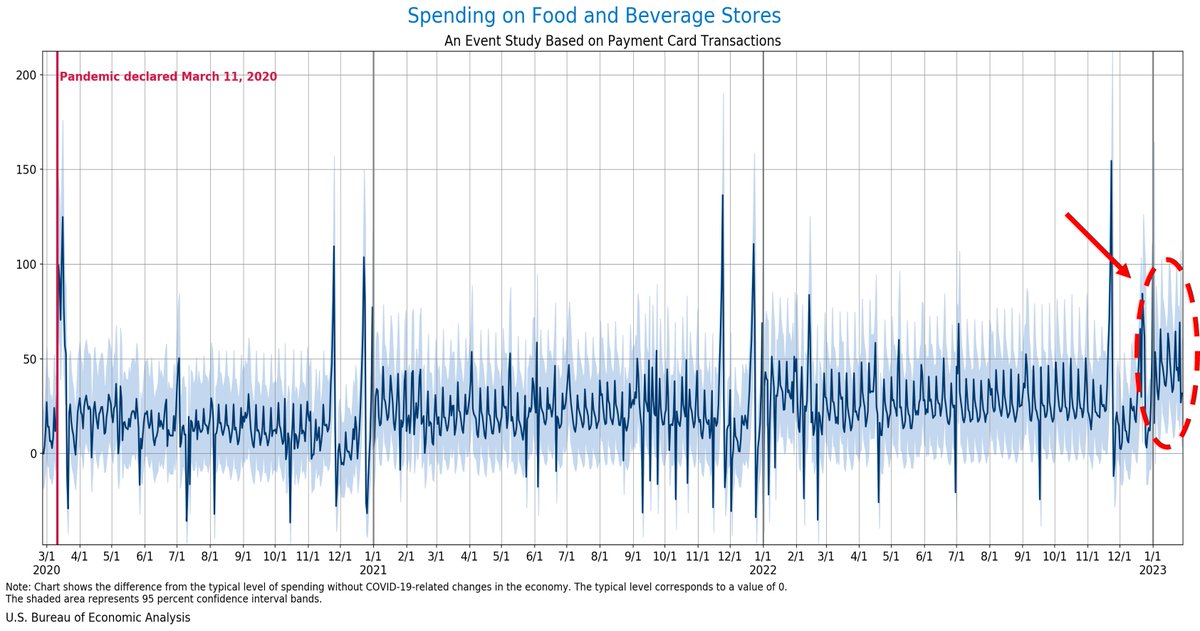
B. With CPI recently falling, moving avgs of Core & Food in the model could result in those terms overestimating the current rate that is computed by the BLS from more current spend data by category.
Counterbalancing this, Food prices themselves may have accelerated in Jan
B. With CPI recently falling, moving avgs of Core & Food in the model could result in those terms overestimating the current rate that is computed by the BLS from more current spend data by category.
Counterbalancing this, Food prices themselves may have accelerated in Jan
8/
So in conclusion there is a notable upward bias to the Cleveland Fed CPI NowCast methodology in the current disinflation environment that needs to be recognized
I guess we'll find out the balance of all these factors very soon
#macro
So in conclusion there is a notable upward bias to the Cleveland Fed CPI NowCast methodology in the current disinflation environment that needs to be recognized
I guess we'll find out the balance of all these factors very soon
#macro
• • •
Missing some Tweet in this thread? You can try to
force a refresh