HedgQuarters S&P500 EPS Forecast Model Update:
1/ In Oct 22 we released our S&P 500 multi factor earnings forecast model based on data releases up to Sept 22. Now with 4-5 months more data we have updated the model and highlight the interesting changes
$SPY $QQQ #macro #stocks
1/ In Oct 22 we released our S&P 500 multi factor earnings forecast model based on data releases up to Sept 22. Now with 4-5 months more data we have updated the model and highlight the interesting changes
$SPY $QQQ #macro #stocks

2/ As always we present 2 scenarios. With variable lags to the impact of rate hikes, these models map out 2 assumption sets:
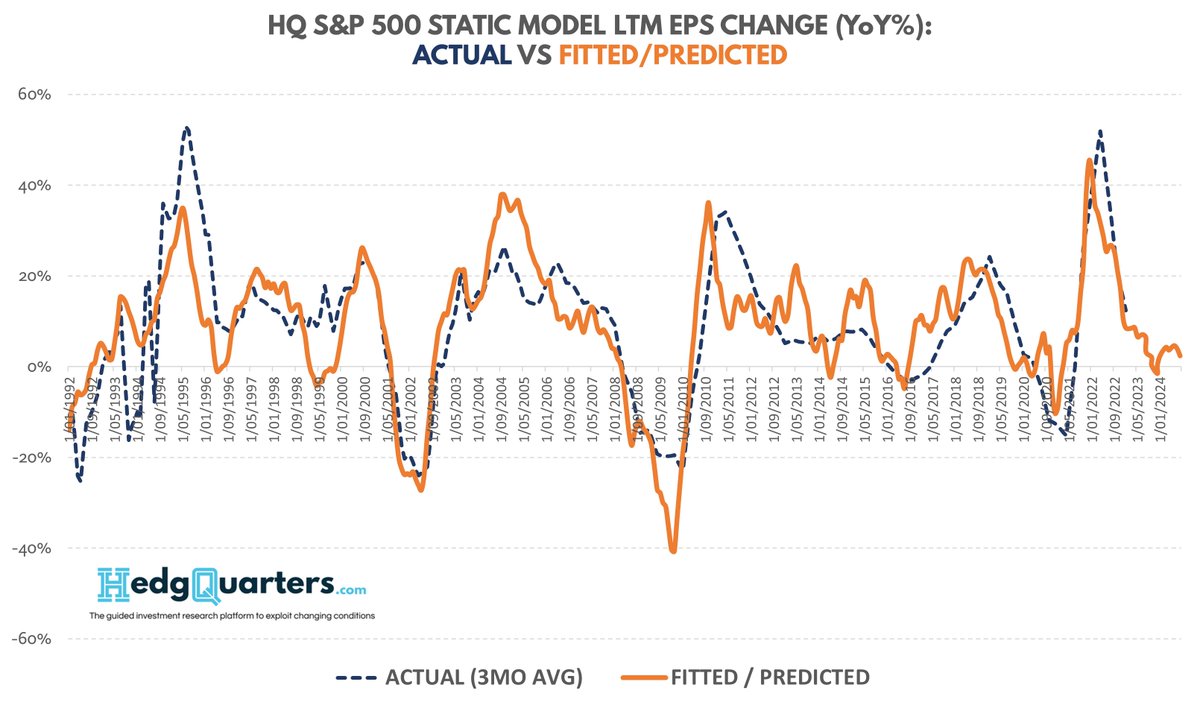
A. the impact on FUTURE EPS of the latest leading econ data, by extending current settings of leading indicators into the future unchanged "STATIC MODEL"
A. the impact on FUTURE EPS of the latest leading econ data, by extending current settings of leading indicators into the future unchanged "STATIC MODEL"
3/ B. "RECESSION MODEL": the impact on future EPS of both current econ data and a forecast assumption set that maps out a possible recession scenario in the US (assumptions at end)
These 2 models allow investors to assess (1) what a recession may look like to earnings and
These 2 models allow investors to assess (1) what a recession may look like to earnings and
4/ (2) where we are today in the progression towards that scenario.
So first what does the STATIC model show and how has it changed since Oct 22?
So first what does the STATIC model show and how has it changed since Oct 22?
5/ The STATIC model (extending current leading data into the future unchanged) broadly now shows that TTM EPS for the #SPX will likely be flat on '22 by the end of 2023.
Interestingly, reflecting the recent hotter econ data, this picture has IMPROVED since Oct '22. Chart shows
Interestingly, reflecting the recent hotter econ data, this picture has IMPROVED since Oct '22. Chart shows
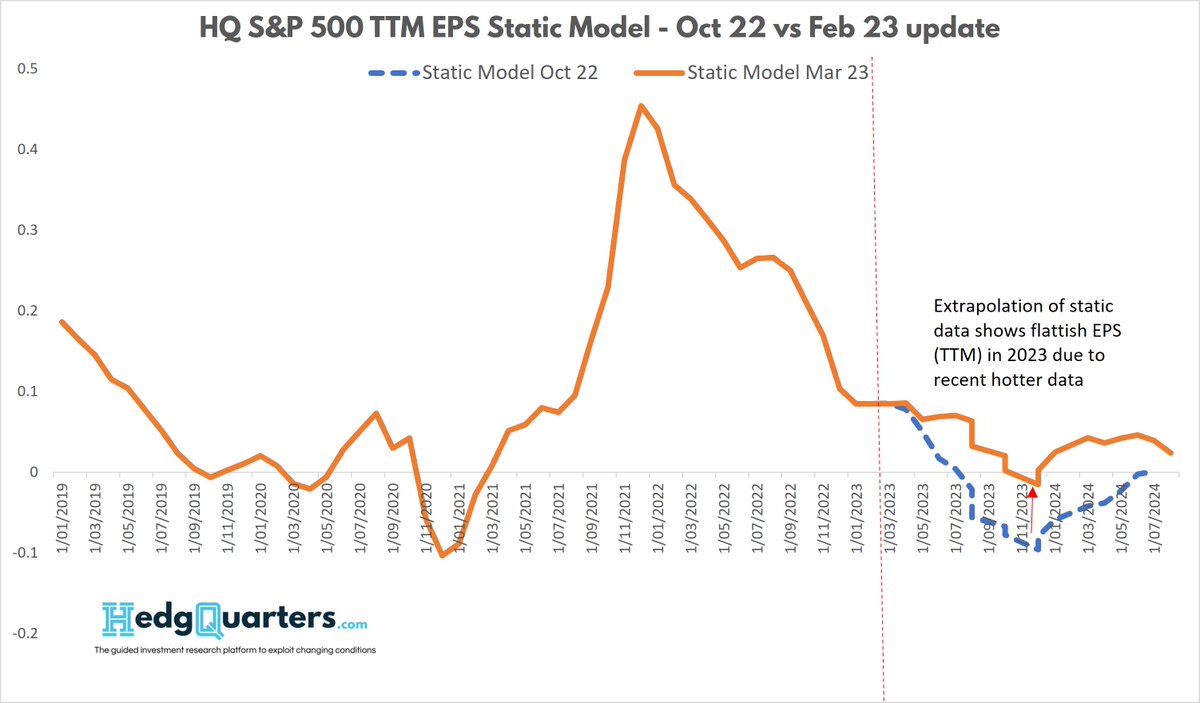
6/ how much the recent better data adds to the future EPS picture, should the data remain constant.
So while back in Oct, leading data was pointing to a 10% EPS decline in '23, recent better data improves this picture to flat EPS w/ moderate growth in '24.
Implications:
So while back in Oct, leading data was pointing to a 10% EPS decline in '23, recent better data improves this picture to flat EPS w/ moderate growth in '24.
Implications:
7/ Importantly, we'd now expect, given consensus '23 EPS has since Jan been revised down to 221 (~flat on '22), the model suggests that results may be more "in line" over the next 1-2 Qtrs with less downward revision near term.
This can be suggestive of a sideways market for now
This can be suggestive of a sideways market for now
8/ But remember, thats a Static forecast scenario that assumes no data improvement or deterioration from here which is instructive for whats already likely to happen near term, but not realistic the further we go out...
So the RECESSION model...
So the RECESSION model...
9/ This model maps out a forecast scenario that we consider realistic near term given hotter CPI, labor, and consumer spend now, but with a deterioration to hard landing out further given higher rate increases will follow (assumptions at end)
Chart shows EPS troughing in Oct 24
Chart shows EPS troughing in Oct 24
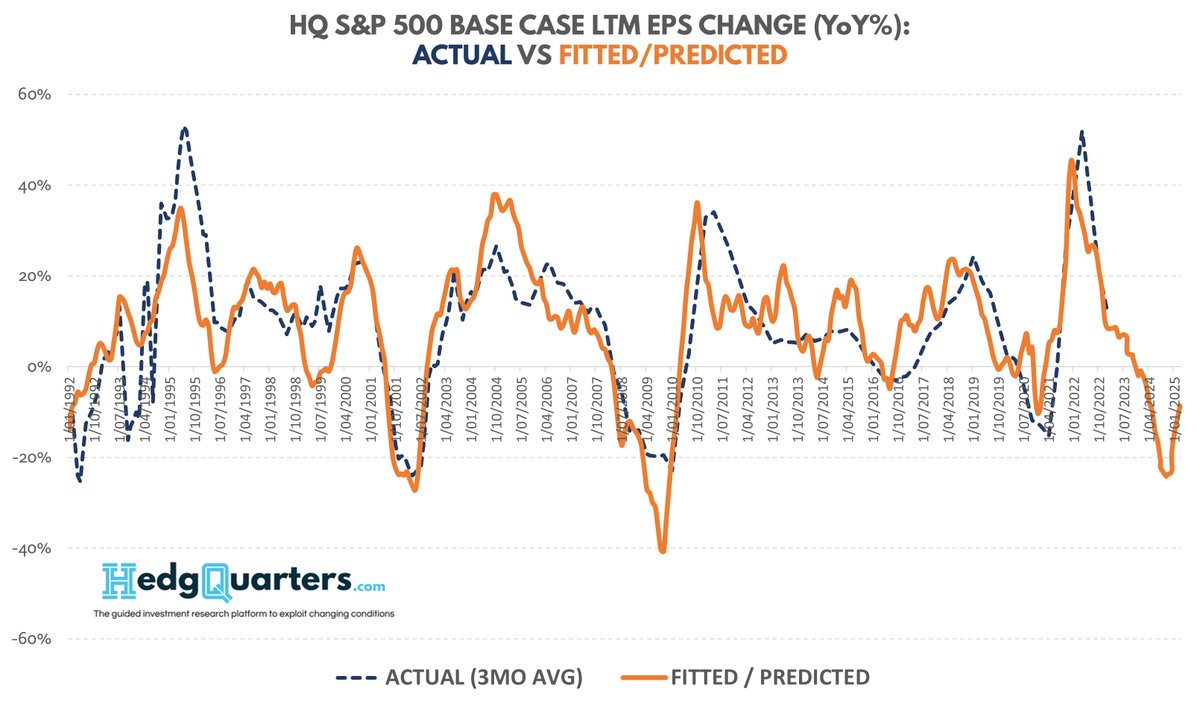
10/ with '23 EPS still only down moderately on '22 reflecting the hotter than expected economy but EPS then falling 20-24% YoY into late 2024, before improving (YoY basis) thereafter.
How has this picture changed since Oct 22? Two main changes are apparent...
How has this picture changed since Oct 22? Two main changes are apparent...
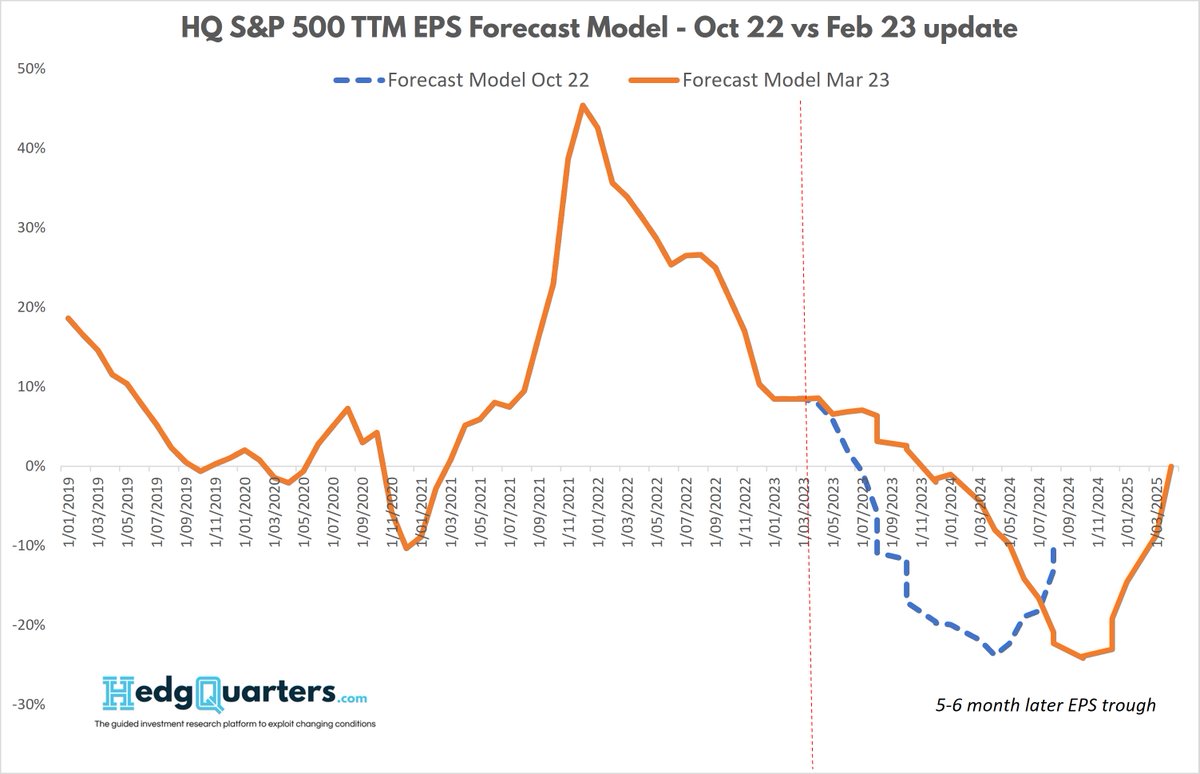
11/ First, as in the Static mode, we are potentially now (dotted line) in a period of flatter EPS (less negative surprise) that delays the fall in aggregate earnings
Second, the EPS trough is pushed out 5-6 months from the model forecast in Oct 22 but retains much the same depth
Second, the EPS trough is pushed out 5-6 months from the model forecast in Oct 22 but retains much the same depth
12/ This RECESSION model assumes typical recession patterns repeat in key variables
- PERMITS decline to ~800k before rate cuts appear
- Manuf PMI declines to low 40's per other recessions
- CONSUMER SENTIMENT bounces for a few months but is pulled back down in late '23 due to..
- PERMITS decline to ~800k before rate cuts appear
- Manuf PMI declines to low 40's per other recessions
- CONSUMER SENTIMENT bounces for a few months but is pulled back down in late '23 due to..
13/ higher rates eventuating
The DXY INDEX bounces back to 110 near term given hotter data and rates, before falling by 20% through '24.
COMMODITY prices have a 3-4 month bounce on China demand before rolling over to recession levels on global demand slump
CPI gets sticky...
The DXY INDEX bounces back to 110 near term given hotter data and rates, before falling by 20% through '24.
COMMODITY prices have a 3-4 month bounce on China demand before rolling over to recession levels on global demand slump
CPI gets sticky...
14/ around 4% until the end of '23 before falling back to 2% on a '24 recession
and of course Fed rates rise to 5.3%, stay there for 6 months before being cut fro mid '24
All this is only a scenario. The purpose is to show how that scenario looks interms of likely EPS trends
and of course Fed rates rise to 5.3%, stay there for 6 months before being cut fro mid '24
All this is only a scenario. The purpose is to show how that scenario looks interms of likely EPS trends
for the #SPX. For me, one of the most salient points of this analysis is that the market might need to adjust to a flatter EPS picture this year, where as in recent past, the market has been bearish on consensus earnings revisions pushing stocks down.
To the extent we are right
To the extent we are right
in modeling this data and its flow through to earnings, heavily shorted stocks expecting further EPS downgrades might get squeezed further in Mar Qtr reporting if this doesnt eventuate as expected
The rate of EPS decline for growth stocks may moderate quite quickly over the next
The rate of EPS decline for growth stocks may moderate quite quickly over the next
1-2 quarters as this activity bump plays through.
So dont get too welded on right now to either the most bullish or bearish narratives.
Rotation after rotation will be the trend of 2023 as hotter data leads to head fakes, momentum reversals, squeezes but eventual falls into '24
So dont get too welded on right now to either the most bullish or bearish narratives.
Rotation after rotation will be the trend of 2023 as hotter data leads to head fakes, momentum reversals, squeezes but eventual falls into '24
• • •
Missing some Tweet in this thread? You can try to
force a refresh