CYCLICALS vs DEFENSIVES:
Renowned investors like Stanley Druckenmiller routinely monitor the performance of Cyclicals vs Defensives as a signal for #stocks, $SPY and #macro economy.
At HQ, we use the following monitor (chart). Whats it telling us now? a 🧵
Renowned investors like Stanley Druckenmiller routinely monitor the performance of Cyclicals vs Defensives as a signal for #stocks, $SPY and #macro economy.
At HQ, we use the following monitor (chart). Whats it telling us now? a 🧵

2/ Lets focus on whats happened, before future expectations
The top panel of the chart shows the relative performance of Cyclical sectors over Defensive sectors ("CDR")
Panel 2 is the #SPX
Panel 3 is the Z-score of the 13 week move in the CDR with 2 std dev movements marked...
The top panel of the chart shows the relative performance of Cyclical sectors over Defensive sectors ("CDR")
Panel 2 is the #SPX
Panel 3 is the Z-score of the 13 week move in the CDR with 2 std dev movements marked...

3/ The final panel (4) shows the rolling cumulative performance of the CDR mapped against HQ's leading economic leading index ("HQLEI", rolling 13 week chg).
From mid '21, the HQLEI fell for the first time in a yr & this preceded the CDR peaking in Nov 21, signaled by...
From mid '21, the HQLEI fell for the first time in a yr & this preceded the CDR peaking in Nov 21, signaled by...

4/ the Z-score. Importantly, you can see that the CDR peak led the #SPX.
The CDR fell through '22 till July & bottomed ahead of the #SPX
In hindsight, the subsequent bounce & resilience in the CDR from Jul-Nov '22 was a key signal & led both the market & the bounce in...
The CDR fell through '22 till July & bottomed ahead of the #SPX
In hindsight, the subsequent bounce & resilience in the CDR from Jul-Nov '22 was a key signal & led both the market & the bounce in...

5/ the HQLEI that appears in mid Jan '23 as better econ data was reported.
Cyclicals have now outperformed Defensives and #stocks have rallied in '23 with the prior deterioration trend in leading econ data neutralizing so far this year.
So where are we now?
Cyclicals have now outperformed Defensives and #stocks have rallied in '23 with the prior deterioration trend in leading econ data neutralizing so far this year.
So where are we now?
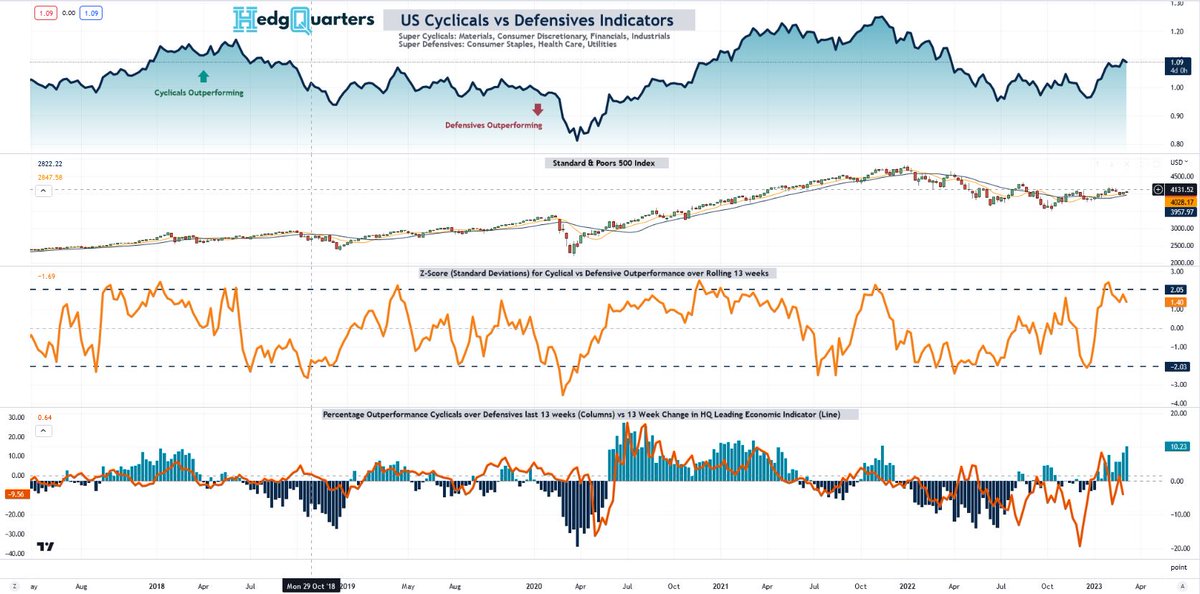
6/ On Jan 31, the CDR reached a 2 std dev 13 week move after a massive rotation to risk-on that caught many out. We saw sizeable factor moves accompany this (video)
The recent pullback in the #SPX notably has not been accompanied by the CDR falling...
The recent pullback in the #SPX notably has not been accompanied by the CDR falling...
7/ Instead it appears more technical in nature due to profit taking & buying/covering being short term exhausted alongside rate expectations shifting up with better growth.
Furthermore, the rolling move in the HQ LEI remains around neutral, certainly better than in '22's sharp
Furthermore, the rolling move in the HQ LEI remains around neutral, certainly better than in '22's sharp
8/ deterioration.
This leads to a reasonable probability for now that Cyclicals can match & even outperform Defensives like in Oct 17-Sep 18 & Aug '20- May '21 where the CDR remained high for an extended period.
With rate hikes continuing, however, I'd expect that any Cyclical
This leads to a reasonable probability for now that Cyclicals can match & even outperform Defensives like in Oct 17-Sep 18 & Aug '20- May '21 where the CDR remained high for an extended period.
With rate hikes continuing, however, I'd expect that any Cyclical

9/ outperformance from here be far more muted than in the 17/18 & '20/21 examples where the HQLEI was improving.
I remain convinced of a later deterioration in economic data again due to inflation & rate pressures, that will precipitate the CDR & #stocks falling once more.
The
I remain convinced of a later deterioration in economic data again due to inflation & rate pressures, that will precipitate the CDR & #stocks falling once more.
The
10/ timing of that however is very uncertain, and so tools like the CDR used alongside both technical and economic trackers such as the HQLEI are what I am monitoring to position my portfolio for short-medium term trends.
As I've said before, '23 will be a year of many rotations
As I've said before, '23 will be a year of many rotations
• • •
Missing some Tweet in this thread? You can try to
force a refresh