1/ Time for a comprehensive thread on current Labor market conditions incl some key indicators to watch closely:
These charts look under the hood of payrolls & unemployment to see how conditions are shifting
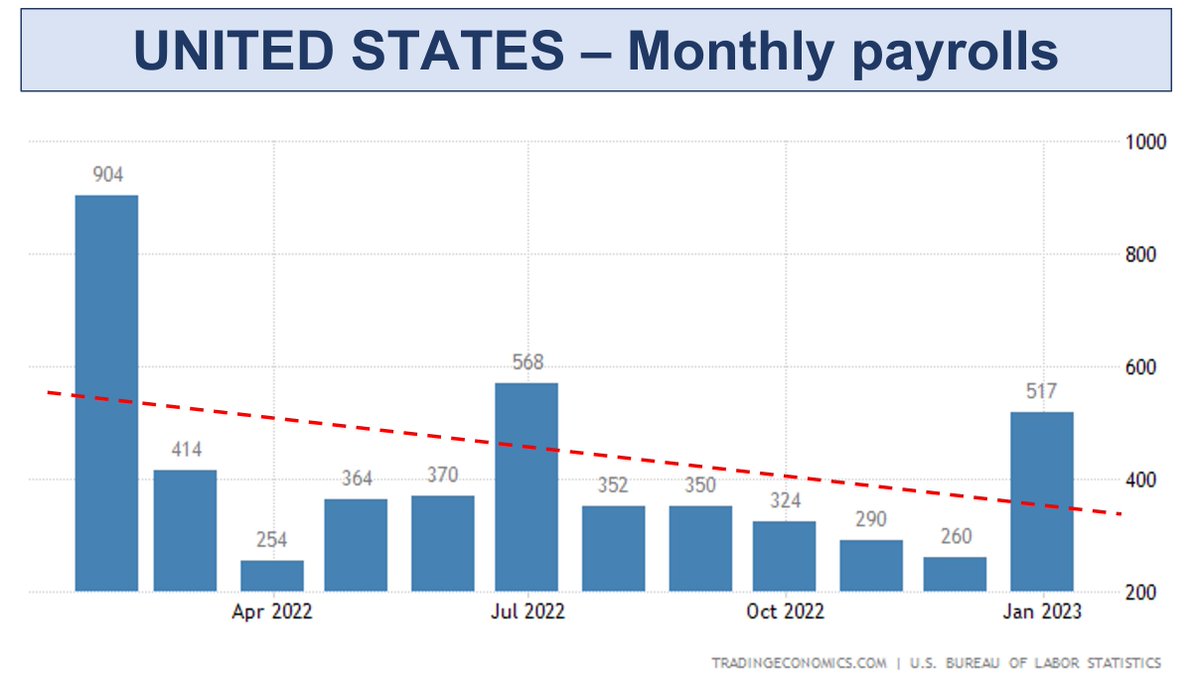
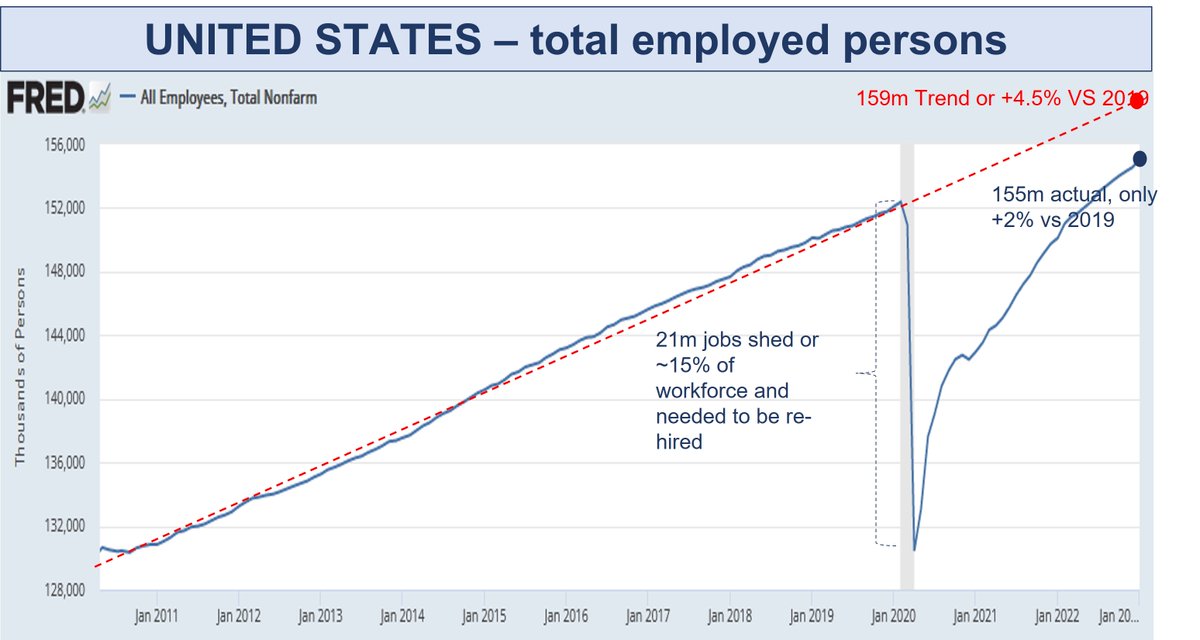
We know employment is still increasing:
#macro #stocks $SPY $QQQ
These charts look under the hood of payrolls & unemployment to see how conditions are shifting
We know employment is still increasing:
#macro #stocks $SPY $QQQ

2/ But less well understood is that under the payroll strength is both falling Hires and Separations.
With labor demand still strong, Quits remain elevated and Layoffs low. But Hires & Separations have both already normalized back to 2019 levels.
With labor demand still strong, Quits remain elevated and Layoffs low. But Hires & Separations have both already normalized back to 2019 levels.

3/ From here, we may well see Separations flatten (already apparent) with reducing Quits as conditions soften (people hold onto jobs) offset by rising Layoffs.
However Hires are likely to continue to fall based on 2 things shown below: Employment intentions & Sales expectations
However Hires are likely to continue to fall based on 2 things shown below: Employment intentions & Sales expectations
4/ The combination of those is what will likely close the gap between Hires & Separations which will be seen in Nonfarm Payrolls (the diff) fall to neutral over the next few quarters.
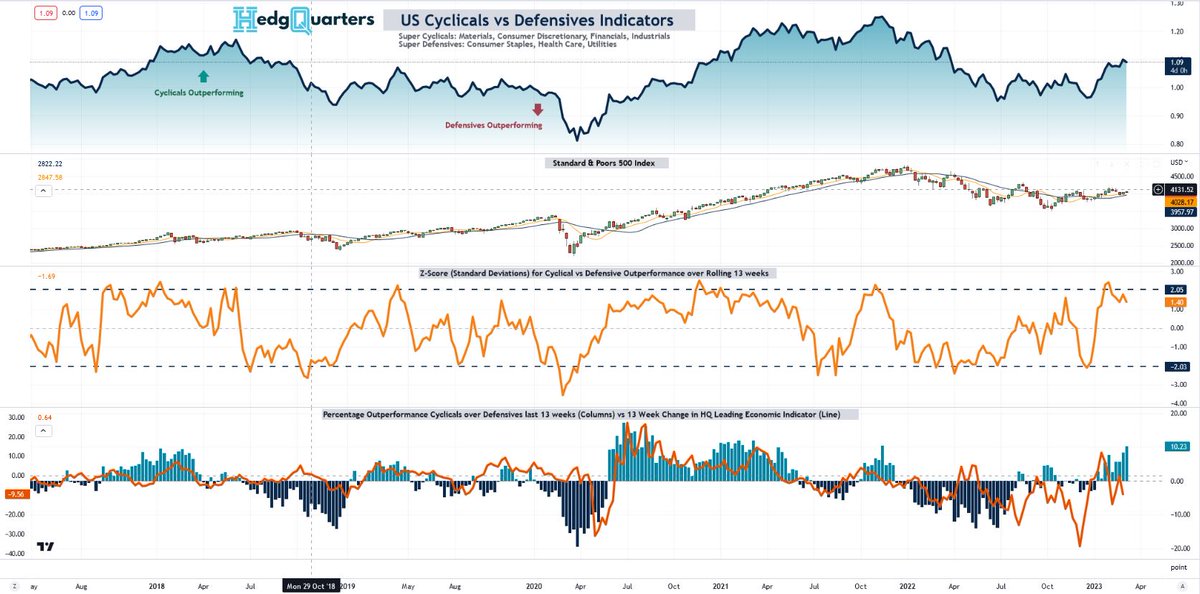
Already, we are seeing cyclical industries again cut workers. Will this repeat like 1H22?
Already, we are seeing cyclical industries again cut workers. Will this repeat like 1H22?

5/ Unemployment Claims are rising from low levels post COVID. They are still below the pre COVID average but getting close.
This trend in Claims is clear and after 12 months of hikes likely to continue, indicating tight conditions loosening under the hood
The UE rate lags this
This trend in Claims is clear and after 12 months of hikes likely to continue, indicating tight conditions loosening under the hood
The UE rate lags this

6/ A more useful indicator of pending recession is the ratio of Initial Claims to Separations. Given labor turnover varies, this can indicate early when more Quits & Layoffs are ending up in the UE queue vs finding work
This ratio rises just ahead of recessions but its not yet.
This ratio rises just ahead of recessions but its not yet.

7/ Its well know job openings are still elevated representing still ~1.6 jobs per unemployed person. I'd expect that this ratio needs to fall to 1.0 or below before a recession is likely near term.
But recognize also that this ratio can change quickly if a shock freezes hiring
But recognize also that this ratio can change quickly if a shock freezes hiring

8/ 9.9m job openings is high relative to history but also represents only about 1.6 months of hiring activity.
It took 6-7 months for the ratio of jobs/UE to rise from 1.0 to 1.7 and in past cycles has always fallen faster than it rose.
Something to keep in mind.
It took 6-7 months for the ratio of jobs/UE to rise from 1.0 to 1.7 and in past cycles has always fallen faster than it rose.
Something to keep in mind.
9/ An interesting and repetitive pattern ahead of recessions is that the ratio of Total Claims to Total Unemployed has always needed to rise to ~45% before a recession occurs
Ie the UE queue is filling up with new rather than long term unemployed. This ratio is rising with
Ie the UE queue is filling up with new rather than long term unemployed. This ratio is rising with

10/ the rising claims shown earlier, however it sits around 35% today with still some way to go.
The total of IC + CC needs to rise ~another 700k to reach a ratio of 45%. Given the steady rise in Claims shown earlier, this represents about 6 months at the same rate
The total of IC + CC needs to rise ~another 700k to reach a ratio of 45%. Given the steady rise in Claims shown earlier, this represents about 6 months at the same rate
11/ The softening in labor conditions ahead continues to be flagged in labor surveys.
Employment growth intentions continue at cyclical lows and job openings follow this with a lag typically
Employment growth intentions continue at cyclical lows and job openings follow this with a lag typically

12/ The NFIB small business labor survey also indicates softening labor demand.
Note that this diffusion index has typically hit a level of 10 as recession hits - its currently at 15 but falling
Note that this diffusion index has typically hit a level of 10 as recession hits - its currently at 15 but falling

13/ Labor conditions dont soften by themselves. One of the largest drivers is the Sales environment. When sales expectations fall, businesses cut back on hiring.
Right now you can see theres a large gap between sales expectations and employment. This represents that sales are
Right now you can see theres a large gap between sales expectations and employment. This represents that sales are
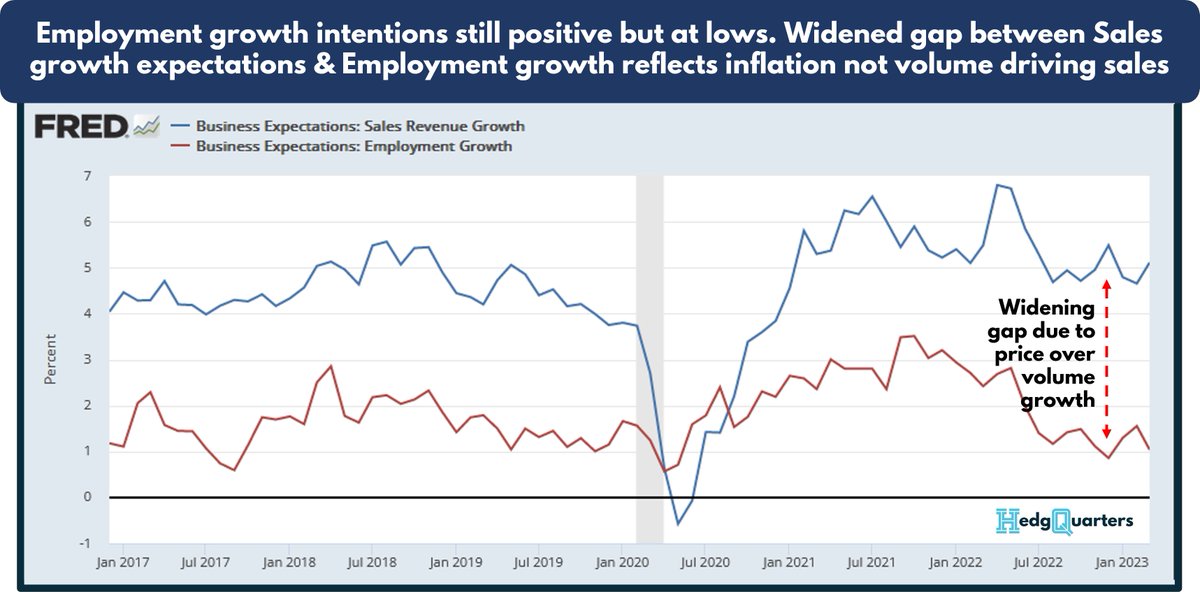
14/ driven more by price (inflation) than volume which is correlated with labor demand.
But as real demand & inflation recede, sales expectations (shown in forecasts below) are being reduced, particularly for small biz.
Total sales forecasts are being cut at annualized -1% to
But as real demand & inflation recede, sales expectations (shown in forecasts below) are being reduced, particularly for small biz.
Total sales forecasts are being cut at annualized -1% to

15/ -2.5% rate currently. This may not sound like much but the sensitivity of employment to sales changes is ~0.5 per Atlanta Fed surveys:
So a 2% reduction in sales can drive a ~1% cut to employment - material when that 1% represents ~ 1.5m jobs
So a 2% reduction in sales can drive a ~1% cut to employment - material when that 1% represents ~ 1.5m jobs

16/ Atm, the reduction in sales forecasts is a cut to GROWTH, reinforcing the expected fall in new hires ahead. But aggregate expected sales growth is only 4.5% & will reduce further as inflation falls.
This link further explains why its likely labor conditions soften further
This link further explains why its likely labor conditions soften further
17/ A final note on WAGES. Reinforcing still tight, but gradually loosening, conditions, like for like wages growth in the Atlanta Fed tracker is still above 6%
More interesting is the wages gap between Stayers and Switchers. This gap is closing but...
More interesting is the wages gap between Stayers and Switchers. This gap is closing but...

18/ it has a track record of closing completely just ahead of recessions.
Such a pattern makes sense. As labor demand weakens, job switchers take whats on offer whereas when theres many jobs, they take the best.
This gap is closing fast currently, and is worth watching closely
Such a pattern makes sense. As labor demand weakens, job switchers take whats on offer whereas when theres many jobs, they take the best.
This gap is closing fast currently, and is worth watching closely
19/ So the conclusions are:
- Labor conditions are softening from tight levels & will continue to do so
- No indicator is flashing recession near term
- Extrapolation of various trends indicate ~6 months is a potential risk point for recession
We'll continue to monitor
- Labor conditions are softening from tight levels & will continue to do so
- No indicator is flashing recession near term
- Extrapolation of various trends indicate ~6 months is a potential risk point for recession
We'll continue to monitor
20/ If you found this useful, consider pre registration for the HedgQuarters.com platform where macro to micro indicators on economies, sectors and stocks are connected together
• • •
Missing some Tweet in this thread? You can try to
force a refresh