Fun with Particulate Matter (PM) Sensors
It is important to actually test and verify your ventilation systems to ensure they are working properly. The good news is my HVAC filter works *very* well. Apparently the outside air is worse than frying eggs constantly in my house. 🧵1/

It is important to actually test and verify your ventilation systems to ensure they are working properly. The good news is my HVAC filter works *very* well. Apparently the outside air is worse than frying eggs constantly in my house. 🧵1/

I was used to seeing very little Particulate Matter (PM) in my house throughout the winter except when we cooked/fried on our electric stove which can make a *lot* of PM. If you fry bacon, you can get PM levels from 30-50 ug/m3 so a lot more than the eggs in this graph. 2/
If you have a ventilation fan above your stove, it is important to have that running when you are cooking to help get the PM generated out of the house instead of in your lungs ( canada.ca/en/health-cana… ). 3/
We had a heat wave so we decided to open up all the windows in the house for the first time this spring to let in "fresh" air and was pretty surprised to see the PM levels spiking so much compared to usual. 4/ 

Our house has an Energy Recovery Ventilator (ERV) so we are constantly bringing in fresh air from outside which helps with ventilation and keeps CO2 levels low in the house. 5/
With all the windows closed our CO2 levels usually range between 530-650ppm depending on how many people are in the house. 6/
With that much PM outside in the city, I was easily able to see just how well the HVAC MERV-16 filter was working since all the outdoor air from the ERV goes through the filter before being distributed throughout the house. 7/ 

The air inside the house also gets returned to the HVAC filter before being recirculated so you can also see how fast PM levels drop after the windows were closed and then returned to very low levels. 8/
So it seems the HVAC filtering is doing its job and filtering the PM from the outside air very well, and the ERV was doing its job to bring in fresh air so we had good CO2 levels inside the house with all the windows closed. 9/
The air quality monitor with PM sensor that I was using is the Canadian built Model E from @IndianaTux ( co2.click/en/product/mod… ). 10/ 
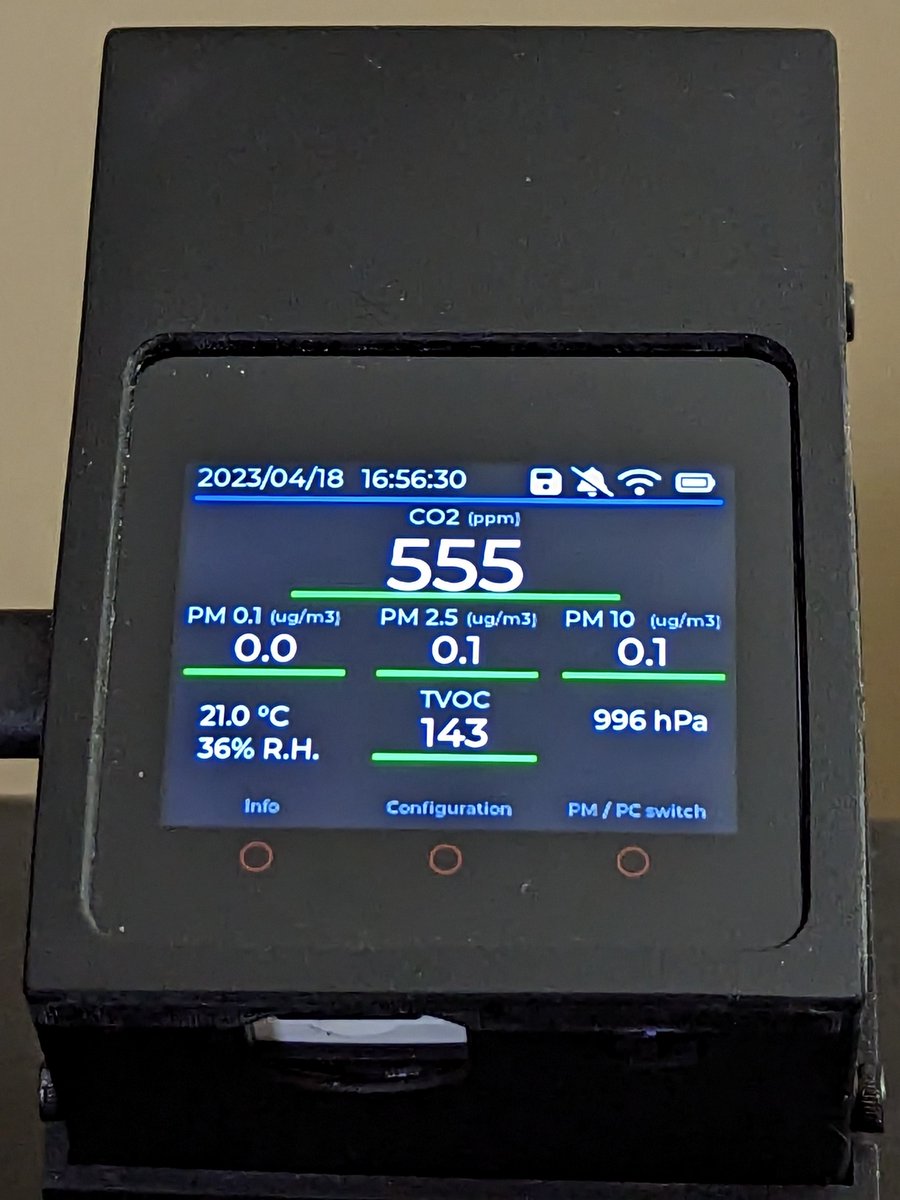
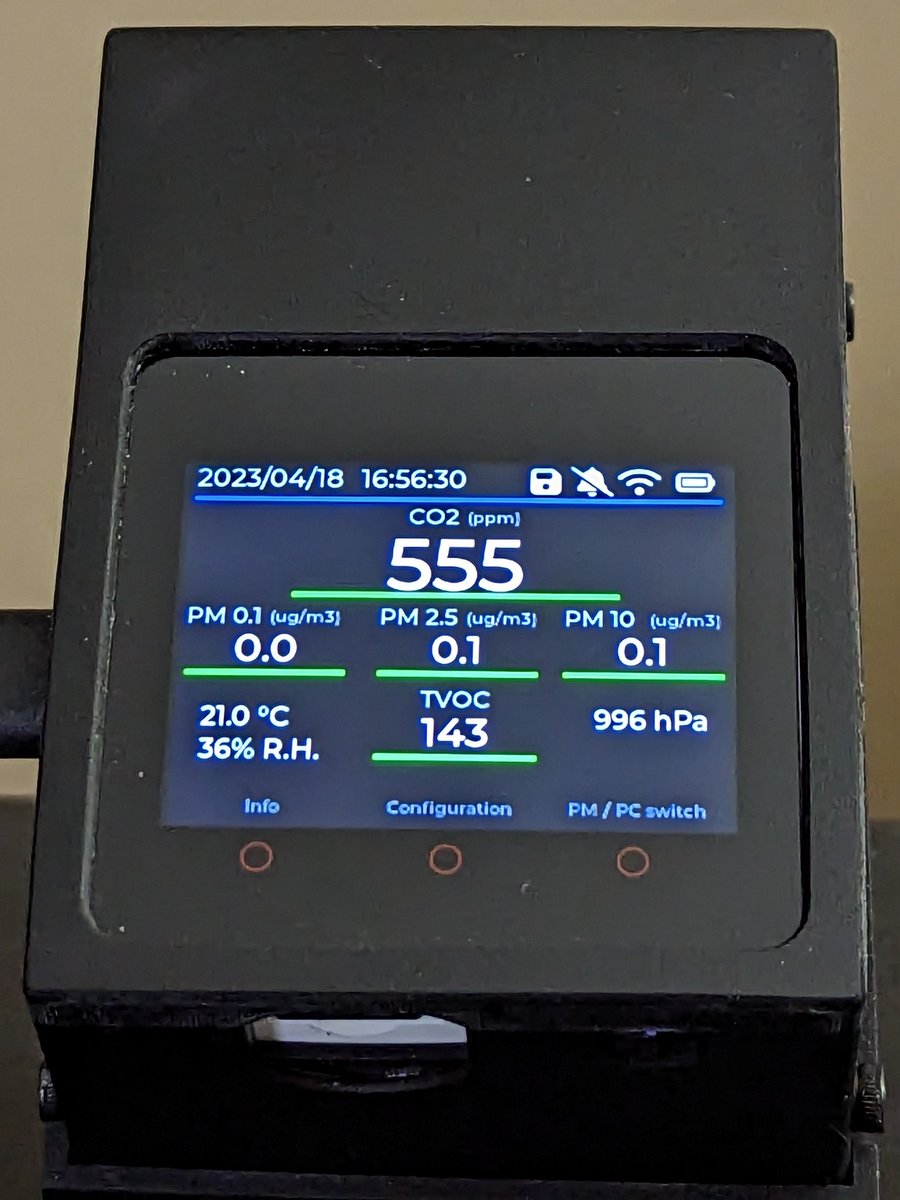
Not only does Model E do CO2 monitoring with a high quality NDIR CO2 sensor, it also measures Volatile Organic Compounds (VOCs), Particulate Matter (PM) ranging from 0.1 to 10 um, Barometric Pressure, Temperature & Humidity. 11/
This model also has a colour touch screen display and will upload your results automatically to an online portal which is where I got the graph from. 12/
You can learn more about the impact of cleaning indoor air, not just from pathogens in aerosol particles but also from other air pollutants linked to various health problems, and what we can do about here (
https://twitter.com/jeffgilchrist/status/1607379781892575234). 13/
Previously I reviewed their Model C monitor which measures CO2, temperature, and humidity (
https://twitter.com/jeffgilchrist/status/1528016215779713024). 14/
I also created a HowTo guide for bringing Model C with you and measuring CO2 away from home (
https://twitter.com/jeffgilchrist/status/1627334427574501378). 15/
The one page easier to share version of this thread can be found at: pingthread.com/thread/1648452…
@threadreaderapp please unroll
• • •
Missing some Tweet in this thread? You can try to
force a refresh

 Read on Twitter


