Prometheus Research Profile picture
Jun 5 12 tweets 6 min read Twitter logo Read on Twitter
The Weekly Recap 🧵

Missed out anything from a week full of #Macro & #Markets? Don't worry - we got you covered.

Below we share all the updates & opinions threads from last week. Make sure to follow @prometheusmacro for much more.
1. We started the week with discussing our view ahead for markets. Our systematic view is that we are headed towards a stagflationary recession.

2. Re 1, we further contextualised our view by sharing our systematic updates on inflation & growth.

3. Next, we shared our Long Only Prometheus Cycle Strategy for stocks & bonds. This strategy leverages our algorithmic macro process to help us decide whether to be invested in stocks, bonds, or cash.

4. This was followed by our opinion thread on Profits, Wages, and Interest Expense in which we discussed that even though revenue growth and wages have moved in a direction consistent with a profit squeeze, corporate interest payments have not.

5. Then we shared our Market Regime Update.

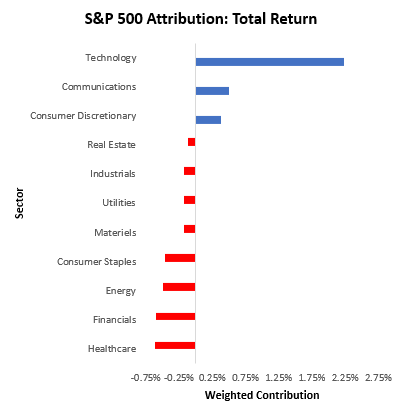
6. Next up, we delved deeper into the recent equity market performance and conducted an in-depth attribution analysis of the S&P 500. Overall, we concluded that recent moves in the equity market have been lopsided & caution is necessary.

7. We then reinforced the idea that particular points in the economic cycle offer an asymmetrically positive return on risk, either long or short assets that can be harvested using a systematic approach and shared the 'Prometheus Cycle Strategies'.

8. We revisted #CPI and provided a complete dissection of the four main components that contribute to most of it's variation.

9. Following the release of Personal Income and Personal Consumption Expenditure data, we also broke down every #component necessary to anlayse the state of the #consumer. Overall, our assessment suggested that the US consumer remains resilient.

10. Finally, we ended the week by sharing our latest updates to the Prometheus ETF #Portfolio and Prometheus Weekly #Trend Signals.

11. If you found this recap helpful, please feel free to share it around and #subscribe to @prometheusmacro.

This will help us further our mission of providing the most #actionable and best #macro research in the business!

• • •

Missing some Tweet in this thread? You can try to force a refresh
 

Keep Current with Prometheus Research

Prometheus Research Profile picture

Stay in touch and get notified when new unrolls are available from this author!

Read all threads

This Thread may be Removed Anytime!

PDF

Twitter may remove this content at anytime! Save it as PDF for later use!

Try unrolling a thread yourself!

how to unroll video
  1. Follow @ThreadReaderApp to mention us!

  2. From a Twitter thread mention us with a keyword "unroll"
@threadreaderapp unroll

Practice here first or read more on our help page!

More from @prometheusmacro

Jun 6
On PMIs

1. Recently, we received new PMI data, which feeds into our PMI composite, whose readings continue to show a weak environment for growth assets (stocks, commodities, & high yield credit). As of the latest available data, our PMI composite now shows a reading of -10.93. Image
2. This was a sequential deceleration from one month prior and a decline in the three-month trend. PMIs are generally strong directional indicators of where we are in the profit cycle, as PMI respondents manage inventories and orders in response to their outlook on profitability.
3. PMI indicators are typically biased toward the manufacturing sector. While this does indeed make sense since production is largely driven by the manufacturing sector, it is important to also separate these sub-indexes to understand the pervasiveness of the current trend .
Read 10 tweets
Jun 5
Market Regime Update

1. Assets rebounded this week, with stocks, bonds, and gold all up on the week. Commodities showed mixed performance, with significant losses during the start of the week weighing on performance. Image
2. Recent #treasury strength continued the recent chop in the market, i.e., moving counter to the recent one-month trend. Below, we show the composition of total treasury market returns over the last month: Image
3. As we can see above, treasuries across the curve continue to show weakness as nominal #GDP continues to show resilience. At the same time, #equity markets continue to show lopsided performance over the past month, primarily driven by valuations rising: Image
Read 6 tweets
Jun 5
On Construction Data 🧵🏚️

1. The most recent data for April show construction spending increased by 1.24%, with 0.2% and 1.04% coming from residential and nonresidential spending, respectively. Image
2. This data surprised consensus expectations of 0.2% and contributed to an acceleration in the twelve-month trend.
3. For further context, we show the composition of the most change in monthly construction spending. The strongest contributor to construction spending in April was Manufacturing, while the weakest was Religious construction spending: Image
Read 8 tweets
Jun 4
@Neuro__Invest thoughts here

1/4 When the government pays interest on its existing RRP, bills, notes, & bonds, it creates income for the private sector. When interest rates rise, these payments to the private sector rise (especially if there’s a lot of short duration assets)…
2/ This income is offset by interest expense liabilities of the private sector. Net interest is the difference between interest income & expense. When companies own a lot of short dated assets (cash, bills, MMFs) relative to long term liabilities (loans,credit, mortgages)..
3/ Interest rates hikes flow to income well before they flow to assets. Now there are nuances about relative weighting & composition- but the big picture is that the current backdrop has seen the net impact of tightening as negligible on corporate profits…..
Read 4 tweets
Jun 2
Dissecting CPI 🧵👇

1. While over 300 line items drive CPI that we have visibility into, we can condense these measures into four broad categories that account for the bulk of the variations: food, energy, transportation, and shelter. We show this composition below: Image
2. Both economically and statistically, these categories explain about 85% of the monthly variation in CPI. Therefore, we think it makes sense to approach our dissection of CPI by evaluating these areas.
3. We believe that food & energy prices can continue to contribute to a softening in CPI, but the swing factor will likely be transportation inflation. So far this cycle, transportation has been a net support to the disinflation we expected over the year. Image
Read 26 tweets
Jun 1
Disinflation requires a Recession, but we are not there yet 🧵

1. Economic #cycles generally follow cause-and-effect templates, and this cycle has followed the archetype, albeit with its unique twists.
2. As an economic expansion ages, the ability for output to accelerate begins to stall as the economy runs up on capacity constraints in the form of production and labor limitations.
3. However, if nominal growth remains strong relative to debt service burdens, credit and income can support employment and production to remain faster than population growth and production capacity.
Read 14 tweets

Did Thread Reader help you today?

Support us! We are indie developers!


This site is made by just two indie developers on a laptop doing marketing, support and development! Read more about the story.

Become a Premium Member ($3/month or $30/year) and get exclusive features!

Become Premium

Don't want to be a Premium member but still want to support us?

Make a small donation by buying us coffee ($5) or help with server cost ($10)

Donate via Paypal

Or Donate anonymously using crypto!

Ethereum

0xfe58350B80634f60Fa6Dc149a72b4DFbc17D341E copy

Bitcoin

3ATGMxNzCUFzxpMCHL5sWSt4DVtS8UqXpi copy

Thank you for your support!

Follow Us on Twitter!

:(