Prometheus Research Profile picture
Jun 20 18 tweets 5 min read Twitter logo Read on Twitter
On Industrial Production & PMIs

1. As of the latest available data, our PMI composite now shows a reading of -10.93. PMIs are generally strong directional indicators of where we are in the profit cycle. Image
2. This is because PMI respondents manage inventories and orders in response to their outlook on revenue and profitability.
3. Nontheless, we ived some degree of mixed messaging from incremental PMI data points. n particular, Empire Manufacturing PMIs showed sequential improvement, while Philadelphia Fed PMI worsened.
4. The latest New York Fed manufacturing survey data showed an expansionary reading of 6.6, surprising consensus expectations of -15.1. This reading was a sequential acceleration within an accelerating trend. Image
5. As we can see above, there tends to be considerable noise in month-to-month changes in the index. Nonetheless, this print was marginally positive, while the three-month trend remains negative. Additionally, we also showcase that sub-surveys of the index generally worsened: Image
6. While Empire showed positive changes, Philadeplhpia Fed PMI worsened. The latest Philadelphia Fed manufacturing survey data showed a contractionary reading of -13.7, disappointing consensus expectations of 0. Image
7. This reading was a sequential deceleration within an accelerating trend. The largest gaining segment was Shipments, and the largest slowdown was in Prices Paid. The breadth of the sub-index data remained weak as well. Image
8. Therefore, a comprehensive take suggests flat PMI conditions at best, if not worse. This PMI data is a timely reflection of the ongoing deterioration in manufacturing activity, which we see as weak industrial production data. We explore this next.
9. The latest data for May shows Industrial Production declined, coming in at -0.16%. This print disappointed consensus expectations of 0.05% and contributed to an acceleration in the three-month trend relative to the twelve-month trend: Image
10. We break this print into its contributions from production coming from Food (-0.04%), Energy (-0.05%), Autos (0.04%), and All Other Items (-0.11%).
11. Additionally, we also showcase the top 10 contributions by industry. The largest contributor this month was Fuels, and the largest detractor was Converted fuel: Image
12. We zoom out to offer further context on the dynamics of industrial production. Over the last year, industrial production has expanded by 0.23%. Image
13. Over the last few decades, the importance of food, energy, and automobiles has risen, accounting for a significant amount of the variation in industrial production.
14. Over the last year, food, energy, and automobiles have contributed 0.73% to the 0.23% change in industrial production. We show this impact below: Image
15. To further assess the health of the current expansion of industrial production, we examine the diffusion of the 28 subsectors we track. This involves examining the number of industries that are expanding versus those that are contracting.
16. We find that 61% of industries are contracting. Below, we visualize how a diffusion index has generally been a good barometer of the durability of upturns and downturns in industrial production: Image
17. To elaborate further, currently, 11 industries are expanding and contributing 1.56% to industrial production, compared to 17 industries showing contraction and detracting -1.42% from industrial production growth compared to one year prior. Image
18. Overall, the latest data continues to suggest #weakness in the manufacturing sector, and given cyclical dynamics, these pressures are likely to intensify.

• • •

Missing some Tweet in this thread? You can try to force a refresh
 

Keep Current with Prometheus Research

Prometheus Research Profile picture

Stay in touch and get notified when new unrolls are available from this author!

Read all threads

This Thread may be Removed Anytime!

PDF

Twitter may remove this content at anytime! Save it as PDF for later use!

Try unrolling a thread yourself!

how to unroll video
  1. Follow @ThreadReaderApp to mention us!

  2. From a Twitter thread mention us with a keyword "unroll"
@threadreaderapp unroll

Practice here first or read more on our help page!

More from @prometheusmacro

Jun 21
🧵 On Liquidity Improvement

1/10 Liquidity is the flow of cash & cash-like assets that potentiates economic and market activity. In this thread, we discuss some of the components of the liquidity ecosystem. Particularly, we focus on short-term liquid assets: Image
2/ There are two dimensions two liquidity: private-sector liquidity and public-sector liquidity. The Fed’s slowing of its liquidity drain has stabilized public sector liquidity. On the other hand, sustained nominal income has continued to flow through to private sector liquidity.
3/ The combination of these dynamics has been a support to liquidity conditions. We show our aggregate tracking of short-term liquid assets below: Image
Read 12 tweets
Jun 19
The Weekly Recap (12.06.23 ~ 16.06.23) 🧵

Missed out anything from a week full of #Macro & #Markets? Don't worry - we got you covered.

Below we share all the updates & opinions threads from last week. Make sure to follow @prometheusmacro for much more.

#MacroMonday #market
1. We kicked off the week with our CPI Preview, highlighting the importance of keeping an eye out for the #used cars and #shelter prints.

2. This was followed by an in-depth analysis of the #fiscal impulse. Overall, our assessment suggested that government #revenues continue to paint a picture of weak private sector conditions.

Read 9 tweets
Jun 19
On Business #Sales

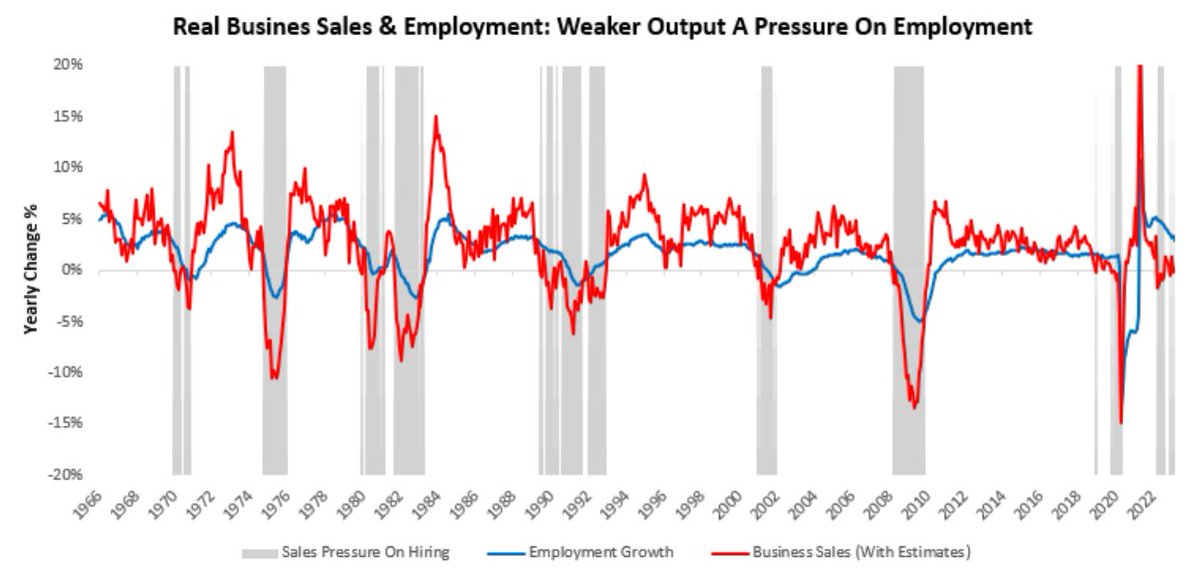
1. While #households create most of the spending in the economy, businesses engage in investment and employment to generate profits. Therefore, sustained #consumption is contingent upon companies using labor to create output. Image
2. Typically, when output has declined, employment has followed suit. We show this in the visualization above.
3. In the visualization presented in 1. we show howe show how periods of decline in real business sales (i.e., business output) create pressure on employment growth. Every period of protracted contraction in real sales has resulted in an eventual contraction in unemployment.
Read 18 tweets
Jun 15
On CPI

1. CPI #Inflation increased by 0.12% in May, surprising consensus expectations of 0.1%. This print contributed to a sequential deceleration in the quarterly trend relative to the yearly trend. Image
2. Above we show the monthly evolution of the data relative to its 12-monthly trend and consensus expectations.
3. At the subcomponent level, the primary drivers of this print were #Motor fuel (-0.2%), #Energy Services (-0.05%), Transportation Commodities Less Motor Fuel (0.11%), #Shelter (0.19%), & #Transportation Services (0.05%). Below, we show the top 10 drivers of the monthly change: Image
Read 8 tweets
Jun 15
Treasury Market Signal 🧵

1. CPI Inflation increased by 0.12% in May, surprising consensus expectations of 0.1%. This print contributed to a sequential deceleration in the quarterly trend relative to the yearly trend. Image
2. However, we think it is important to note that excluding food and energy, i.e., core CPI, was up 0.40% this month— implying a 4.9% annualized rate for core inflation. This data is far removed from the Fed’s objective.
3. As such, #bond markets have moved to re-#discount expectations, moving away from aggressive expectations of easing, consistent with our views outlined in our Month In Macro note. We show this below: Image
Read 6 tweets
Jun 14
CPI Preview vs Realized CPI

1. #CPI data came out largely in line with our expectations. Our expectations were for a print of 0.17%, while the print came in at 0.10%. Below, we show the composition of our estimates relative to the realized print: Image
2. Our pre-view note mentioned two factors we would be watching out for. First, we were looking to see whether #motor vehicle inflation remains persistent.
3. Given the industry dynamics we monitor, there was a potential for new cars to see deflation as manufacturing productions alleviate some degree of supply shortages. Nonetheless, #used car inflation likely showed significant potential to re-accelerate this month.
Read 6 tweets

Did Thread Reader help you today?

Support us! We are indie developers!


This site is made by just two indie developers on a laptop doing marketing, support and development! Read more about the story.

Become a Premium Member ($3/month or $30/year) and get exclusive features!

Become Premium

Don't want to be a Premium member but still want to support us?

Make a small donation by buying us coffee ($5) or help with server cost ($10)

Donate via Paypal

Or Donate anonymously using crypto!

Ethereum

0xfe58350B80634f60Fa6Dc149a72b4DFbc17D341E copy

Bitcoin

3ATGMxNzCUFzxpMCHL5sWSt4DVtS8UqXpi copy

Thank you for your support!

Follow Us on Twitter!

:(