✅LSTM and ARIMA model in Time Series Forecasting explained in simple terms and how to use it ( with code).
A quick thread 🧵👇🏻
#Python #DataScience #MachineLearning #DataScientist #Programming #Coding #100DaysofCode #hubofml #deeplearning
Pic credit : MDPI
A quick thread 🧵👇🏻
#Python #DataScience #MachineLearning #DataScientist #Programming #Coding #100DaysofCode #hubofml #deeplearning
Pic credit : MDPI

1/LSTM model - Imagine you have a magical toy that can predict the weather for the next few days. You want to know if it will rain or be sunny each day. To make accurate predictions, the toy needs to remember the patterns it has seen in the past.
2/ An LSTM model is like a smart friend who can remember things really well. It has a special memory that helps it understand and remember patterns in the weather. This memory helps the LSTM model make better predictions about whether it will rain or be sunny.
3/ The LSTM model looks at the weather data from the past, like the temperature, humidity, and wind speed for each day. It tries to find patterns in this data. For example, it might notice that when the temperature is high and the humidity is low, it's usually sunny.
4/ The LSTM model learns these patterns over time. It keeps updating its memory as it sees more and more weather data. Once it has learned these patterns, it can use them to predict the weather for future days.
5/ So, when you give the LSTM model the weather data for the current day, it will use its memory to make a prediction about whether it will rain or be sunny tomorrow. It does this by looking at the patterns it has learned from the past data.
6/ ARIMA model - Imagine you have crystal ball to predict how many cookies you will eat each day. Sometimes you eat more cookies, sometimes you eat fewer cookies. To understand the pattern of your cookie consumption & use it to predict how many cookies you will eat in the future
7/ An ARIMA model is like a smart cookie-eating detective. It tries to figure out the pattern in your cookie consumption by looking at the data from the past. It wants to know if there's a trend or a cycle in your cookie-eating habits.
8/ The ARIMA model looks at the number of cookies you've eaten on different days. It tries to find patterns, like whether you tend to eat more cookies on weekends or if your cookie consumption increases over time.
The ARIMA model then uses these patterns to make predictions.
The ARIMA model then uses these patterns to make predictions.
9/ The ARIMA model also considers how the past patterns affect the future. It takes into account difference b/w the cookie consumption on different days. Eg. if it sees that you ate 5 cookies today and 3 cookies yesterday, it will consider this difference when making predictions
10/ LSTM is a type of neural network specifically designed to handle sequential data like time series. It is particularly useful when the data has long-term dependencies or complex patterns. LSTM models have a memory cell that can store and remember information over long periods.
11/ LSTM models are used:
The time series data has long-term dependencies and complex patterns.
There are seasonal or cyclic patterns in the data.
The data has multiple input features or variables.
There is a need to capture both short-term and long-term dependencies in the data.
The time series data has long-term dependencies and complex patterns.
There are seasonal or cyclic patterns in the data.
The data has multiple input features or variables.
There is a need to capture both short-term and long-term dependencies in the data.
12/ Use LSTM when the data has complex patterns, long-term dependencies, or seasonal/cyclic behavior. LSTM models can handle multiple input features and can capture both short-term and long-term dependencies in the data. Implementation -

13/ ARIMA (AutoRegressive Integrated Moving Average): ARIMA is a statistical model that captures the linear dependencies in the data. It is commonly used when the data has a stationary trend, meaning that the statistical properties of the data remain constant over time.
14/ ARIMA models are suitable when:
The time series data has a stationary trend (i.e., the mean, variance, and autocorrelation do not change significantly over time).
The data has a clear linear pattern or trend.
There is no significant seasonal or cyclic component in the data.
The time series data has a stationary trend (i.e., the mean, variance, and autocorrelation do not change significantly over time).
The data has a clear linear pattern or trend.
There is no significant seasonal or cyclic component in the data.
15/ Use ARIMA when the data has a stationary trend and a clear linear pattern. ARIMA models are useful for capturing linear dependencies and are simpler to interpret compared to neural networks. Implementation -

16/ LSTM models for univariate time series forecasting - In univariate time series forecasting, we have only one variable or feature to predict the future values. The LSTM model takes a sequence of past values as input and learns to predict the next value in the sequence.

17/ LSTM models for multivariate time series forecasting - In multivariate time series forecasting, we have multiple variables or features that are used to predict the future values. An LSTM model is able to handle multivariate time series by including multiple input features.

18/ LSTM models for multi-step time series forecasting - In multi-step , we aim to predict multiple future time steps instead of just the next time step. An LSTM model can be adapted to perform multi-step forecasting by modifying the o/p layer and training it accordingly.

19/ Bidirectional LSTM: A Bidirectional LSTM is a variant of the LSTM model that processes the input sequence both in forward and backward directions. By considering the past and future context simultaneously, it can capture dependencies in both directions.

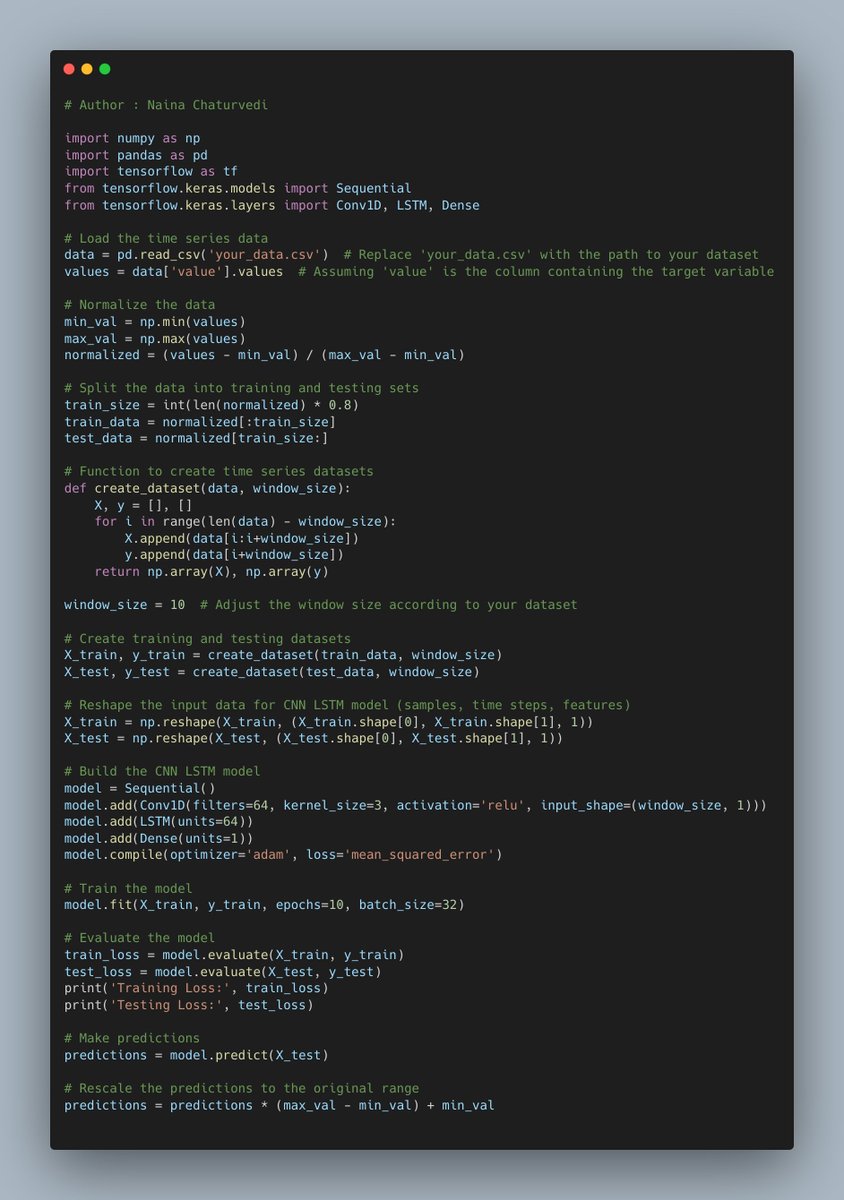
20/ CNN LSTM: A CNN LSTM model combines the convolutional neural network (CNN) and LSTM architectures. It uses the CNN layers to automatically extract features from the input sequence and then feeds the extracted features into LSTM layers to capture temporal dependencies.
21/ ConvLSTM: A ConvLSTM model extends the LSTM model by adding convolutional layers before the LSTM layers. It combines the ability of convolutional layers to automatically extract spatial features and the ability of LSTM layers to capture temporal dependencies.

22/ ARIMA (Autoregressive Integrated Moving Average) is a popular model used for time series forecasting. It combines autoregressive (AR), differencing (I), and moving average (MA) components to capture the temporal patterns in the data.

23/ The Autoregressive component captures the relationship between an observation and a certain number of lagged observations. It models the current value of a time series based on its previous values.

• • •
Missing some Tweet in this thread? You can try to
force a refresh