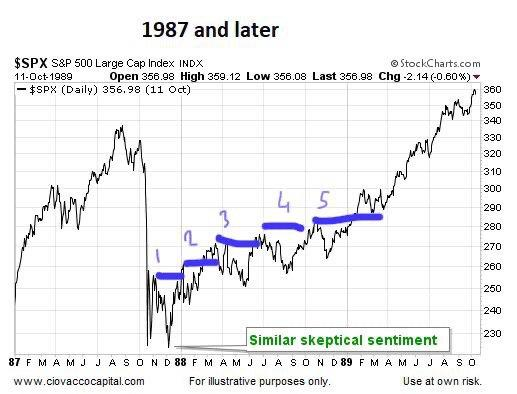
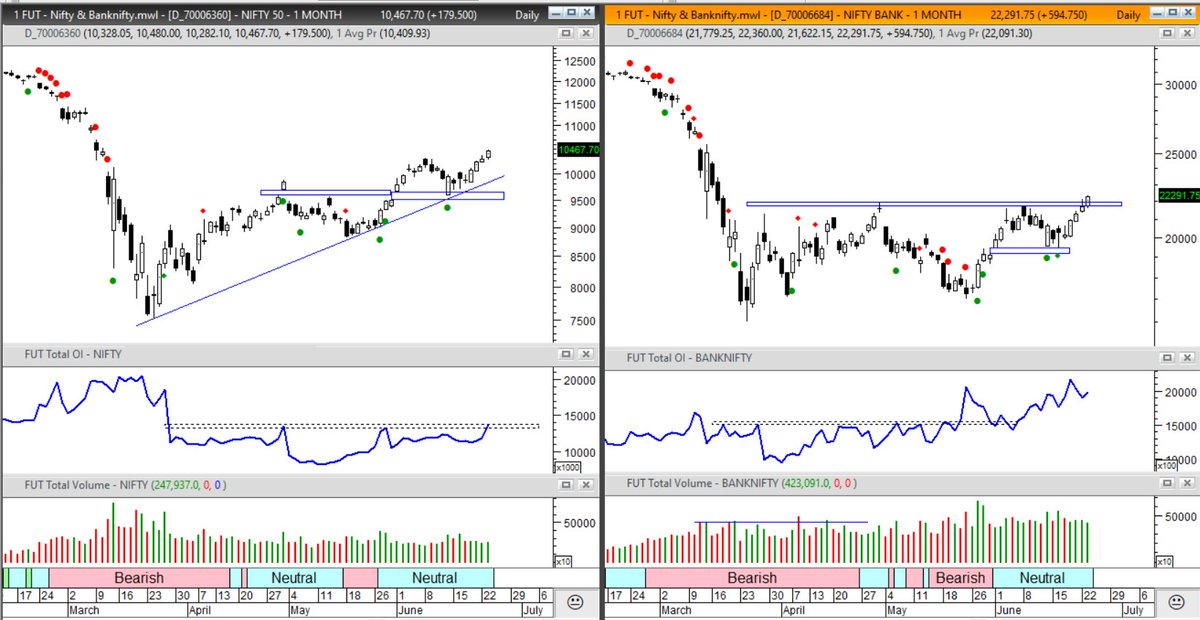
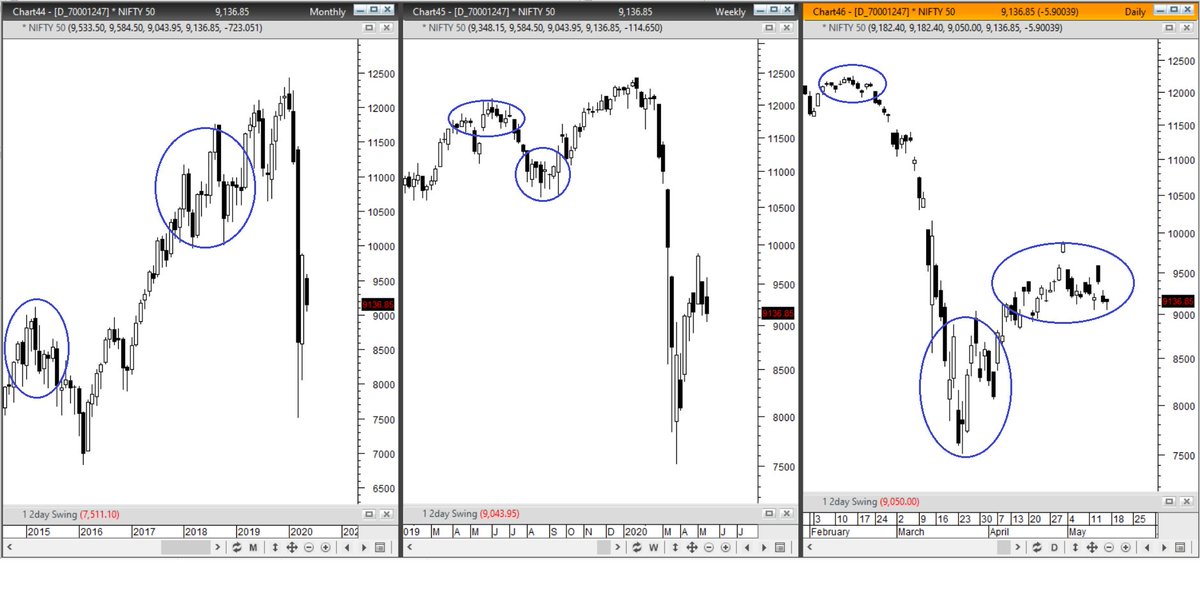
It is not yet a "NEUTRAL" and oversold chart. That would be "Buy" signal. Last three year System chart @WeekendInvestng
300pts correction in last 13 days.. is it significant or more weakness pending? Key reversal level on close above 9905. Support level -9470
@WeekendInvestng 3 /4 Timeframes r showing bearish signal based on Trend Following (system 2) on #Nifty. (Its better to be a system follower than ASTROLOGER)
It looks like it is not going to be a smooth ride anymore.
Non-Volatile Uptrending momentum has ended.
Updated #NIFTY chart. No clear view at current levels. However, anticipating a Bullish pattern to form.
@WeekendInvestng Nifty Future retested Previous week's Average Traded Price and reversed (nearly 75 pts). It should now act as strong support. Lets see.
#Nifty breached Target and reacted.. #Banknifty is still showing fresh breakout. #Midcap100 - formed complex H&S pattern #Value Chart - showing increase in volatility #Step&Ladder chart - new Step Up
#Nifty and other indices charts. Retracement of 100% price move in less than 50% of the time is not good as of now. #Trend of all indices are down as of now. Reversal only when Higher high with small retracement (higher low) is formed.
#Nifty charts in 3 formats (Candlestick, High-Low sequence and Closing Line). Multiple support region at 10400-10530.
#Nifty 500 Index - Complex Head and Shoulder formation on large timeframe.
Bulls: Neckline support and 200 DMA support
Bears: Consecutive Lower Lows and Lower Highs and large distribution.
Lets see who wins.
#Nifty 500 index - gap down likely from neckline and 200 EMA... interesting scenario
Gap Down = Bearish Momentum
Break of 200 DMA = Breakdown from long term support.
#Nifty500 index has broken 200EMA with a GAP down. (not a good sign)
#Nifty charts - Downtrend channel is now getting steeper in daily chart. Weekly chart shows break of long term support.
#Nifty - all indices short term trend update. Trend has changed to up but bias is still down. Short trigger on new uptrend failure pattern only.
"Trend has changed to up but bias is still down."..... so bias worked today.. Pattern failures have stronger implications. #Nifty
Pattern did not fail eventually and Uptrend held up strongly.
Current Trend : Up
Bias: Up
Step & Ladder chart showing momentum. #Nifty and #Banknifty
Trend following signals on Step & Ladder chart - #Nifty #Trend is Up as of Now.
All type of charts in #Nifty are saying the same thing "as of now".
The TREND is Up.
High-Low Sequence chart
Step and Ladder Chart
Swing Line Chart
All indices on High-Low sequence charts.
Trend remains Up as of now. #Nifty
#Nifty at Make or Break Level... 10500-10700 zone
Notes:
Upmove is slower than previous decline (swing high of 10632)
RSI went below 33 & now near 67
The recent rise is in 50-61.8% retracement zone (additional strength confirmation only above 61.8% level)
#Nifty and Other indices.
Banknifty is outperforming while other indices are showing sell signals on short term timeframe.
#Nifty and Midcap Index chart : Largecaps are Bullish and Midcaps are Bearish.
Sign of Accumulation or Distribution? I guess a Higher High or a Lower Low sooner than later will confirm that.
Market Breadth data and Indices Chart of #Nifty and #Midcap100...
something is really boiling hard in the internals of market.
#Nifty and other indices weekly chart
Largecap in Uptrend vs Midcap in Downtrend,
Which trend of the above will be forced to change its course?
#Nifty and Other Indices Charts (the setup is weak unless market does otherwise)
Facts:
F&O stocks > 20DMA :31%
F&O stocks > 50DMA :37%
F&O stocks > 200DMA :46%
Today:
Up with Higher Volume: 48
Down with Higher Volume 101
#Nifty and other Indices (weekly charts)
Nifty - Change of Trend signal to down a week after the Midcap index
Banknifty - Trend is still Up but there is a breakout failure
Midcap - Trend is Down
#Nifty and other indices - Weekly charts patterns #Nifty - Symmetrical Triangle #Banknifty - Upward sloping channel #Midcap - Downtrend with expanding triangle
#Nifty and other indices - Daily charts. #Nifty - reversed from key resistances. Broke 2 day's low today; Short term sell signal #Banknifty - Breakout failure and sell signal again #Nifty500 - Downward sloping expansion & fresh sell signal. #Midcap - Inverted Cup & Handle pattern
Flying KITE pattern in #Nifty. No clarity of major direction as of now.
4th Higher High formation
No weakness in volume to assist divergence
20Day ATR now 250pts (ATR falling means low volatile zone in an Uptrend which is bread butter for Trend Followers)
My view: Bullish as there is no sign of weakness yet.
Earlier I explained how to make charts cleaner by using Two day Swing Lines & today I explained how to identify Relative Highs & Relative Lows in an objective manner
Link1:
A thread on how to Define correct Swing Highs / Lows for the purpose of Dow Theory analysis or drawing Trendlines:
Thomas DeMark in his book "The New Science of Technical Analysis" said that drawing
of trend lines is a highly arbitrary process. 1/n
A trend line is typically intended to connect
several Relative Highs or Relative lows. If there are two or more such points, the trend line can be drawn
precisely. (notes from Jack Schwager's book "The Complete Guide to the Futures Market").. 2/n
Relative high is a High that is higher than high on the N prior & N succeeding bars.
where N is a number of bars (can be anything as per individual's setup 5 / 10 / 20...)
if N = 5, Relative High is Current High > last 5 days & succeeding 5 days. Viceversa for Relative Low.. 3/n
Further to my initiative of #LetsLearn where my objective is to de-code complex things & make things simple and available for analysis...
Today, I will try to make a complex looking chart into a clean & simple one (only useful for people who are PATTERN based trader/analyst)..1/n
Further as disclaimer, the presented way will be more useful for people who have followed Martin Pring's book on chart patterns.. (images taken from Kindle version of the book)
The below are Candlestick charts of #NIFTY50.. a lot of times market moves inside a range throwing multiple Bullish/Bearish candlestick patterns and adds up the clutter in analysis (Pro Candlestick / Bar / short term traders wont have a problem) but for others it is a confusion..