 2. grippe et infections respiratoires aigues (IRA) selon réseau Sentinelles (consultations en MG) et "cas" ("test" > 0)
 #covid19france comparaisons 2021 vs 2020


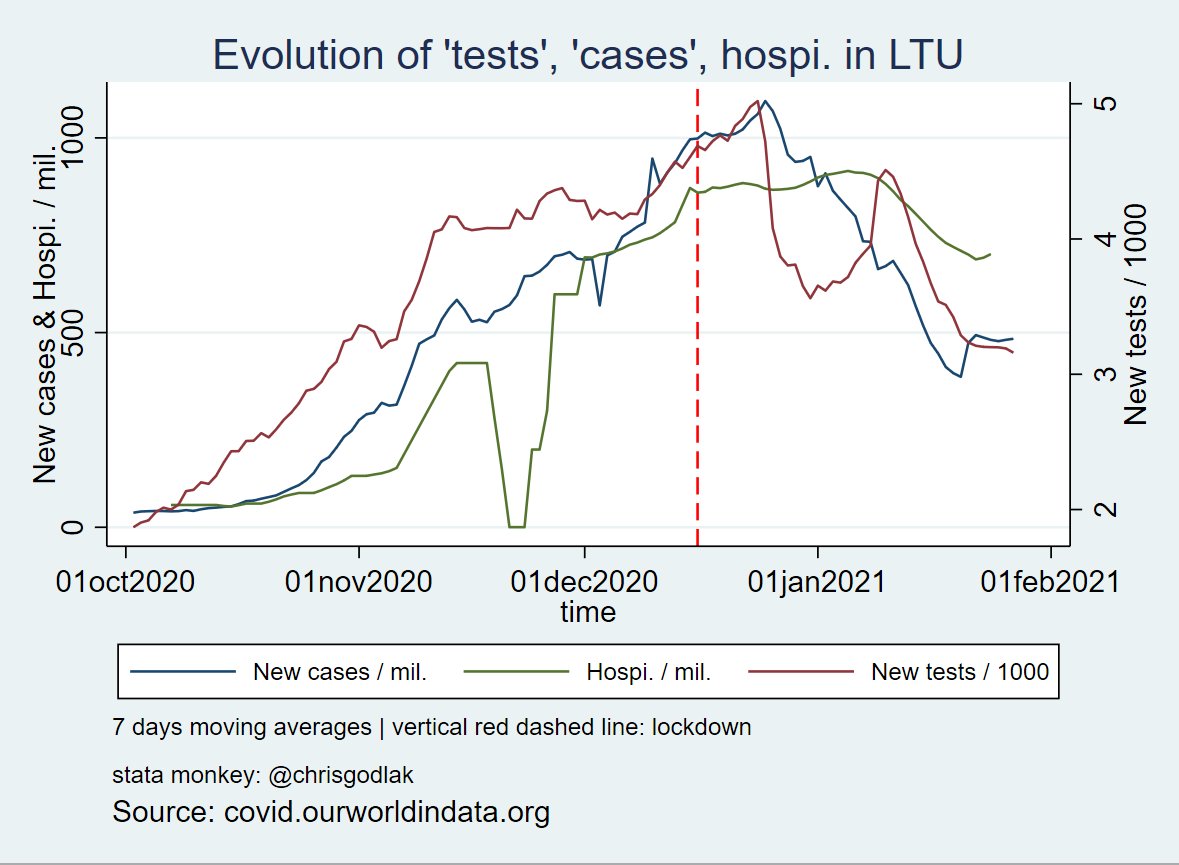
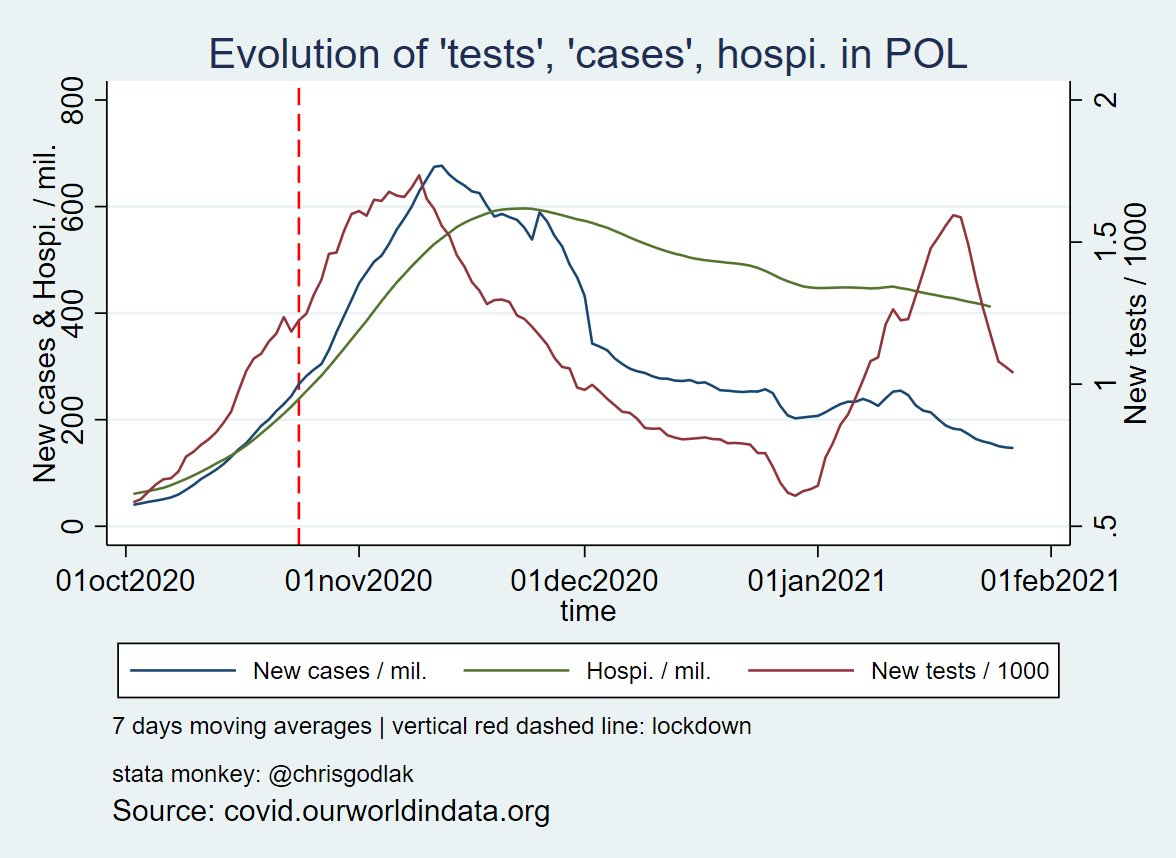
 ensuite, et en dépit d'inférence statistique digne de ce nom, il faut au minimum présenter toutes les courbes sur un même graphique (et tant pis pour la simplicité), puisque seulement ainsi peut on avoir une vision d'ensemble de la situation sur plusieurs aspects:


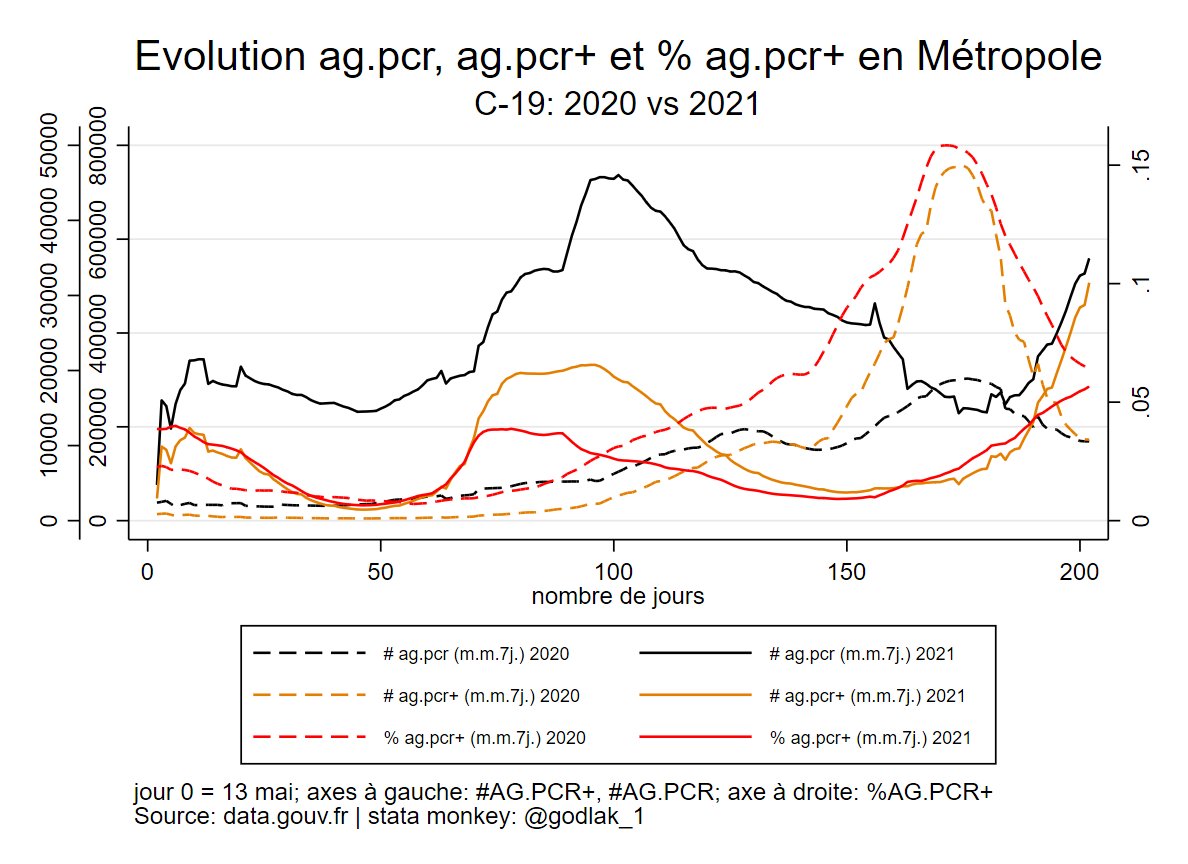 #covid19france : comparatifs 2021 vs 2020

 @HMDatabase Excès mortalité 2021 en France


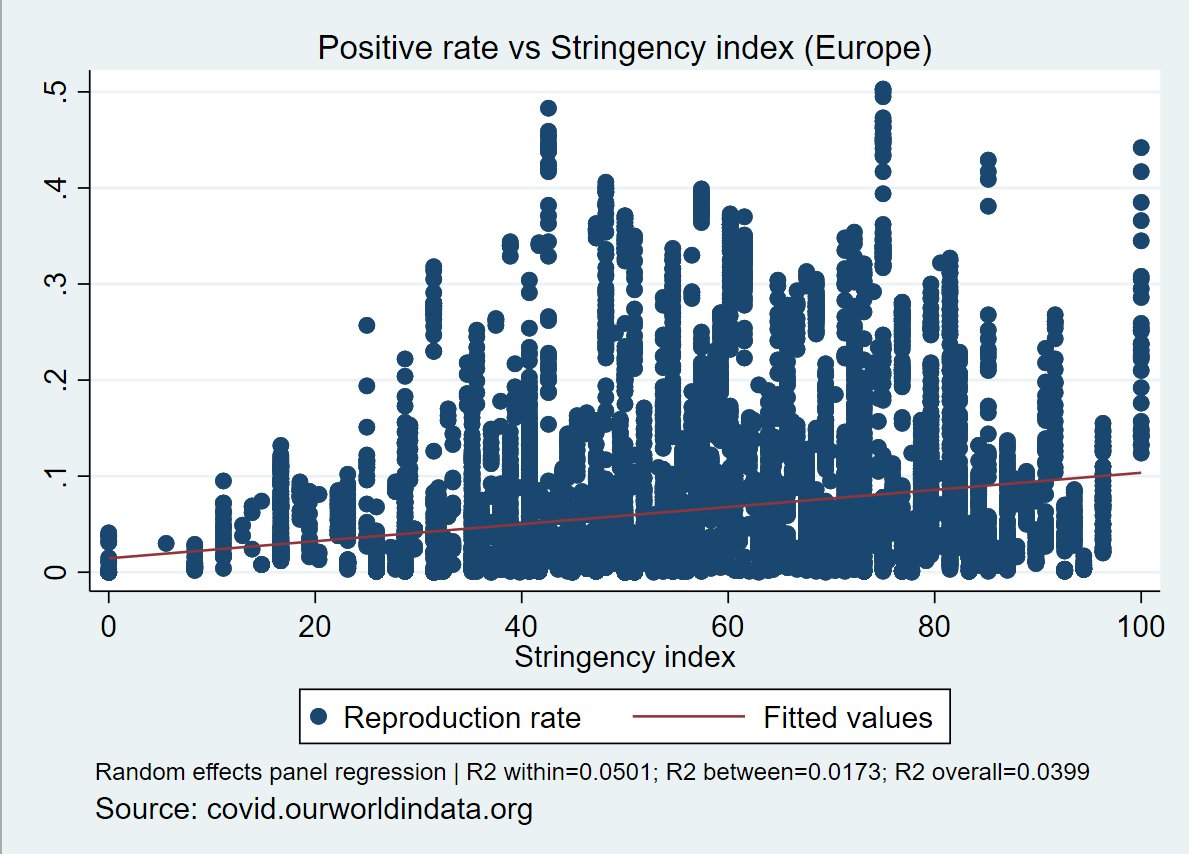
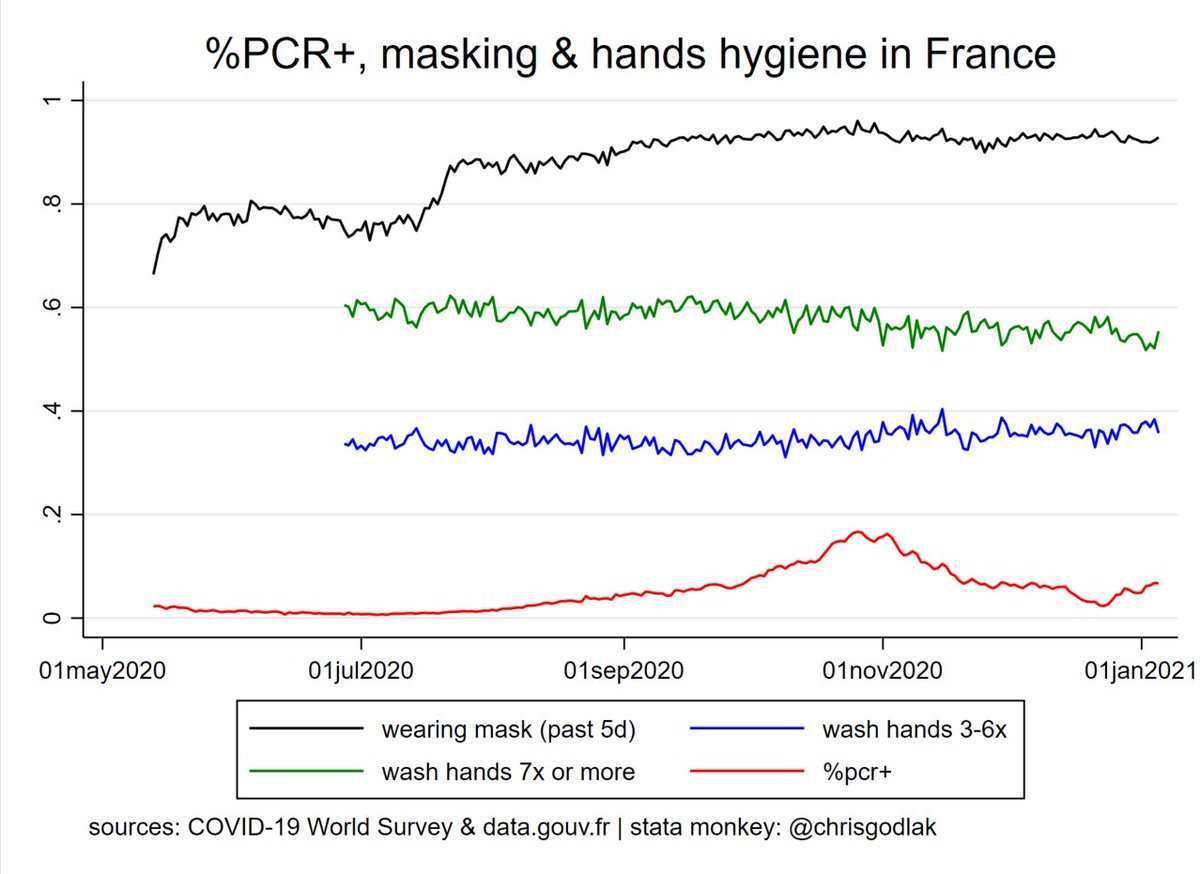 essential shoping (shops, groceries, pharmacies...) and "positivity" rate are two distinct and separate process :p


 2. les proportions des 60 à 74 ans augmentent surtout partout, depuis 2006 environ