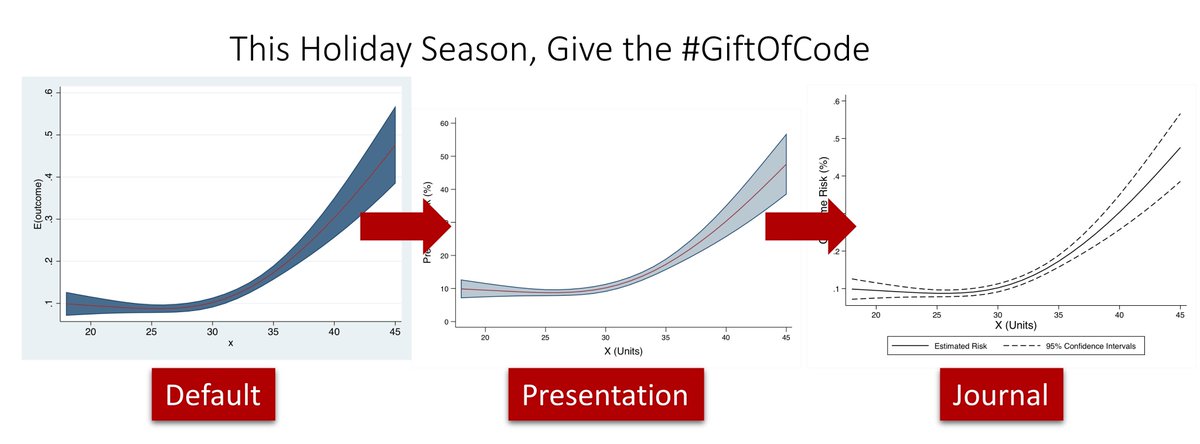
I’m feeling festive! I want to spread the cheer this holiday season by giving the #GiftOfCode for making beautiful figures! #EpiTwitter #StatsTwitter
🎄🎅🎄🎅🎄🎅🎄🎅🎄🎅🎄🎅🎄🎅🎄🎅🎄🎅🎄🎅

Nothing was more valuable than example code for learning different #DataViz options 🎁
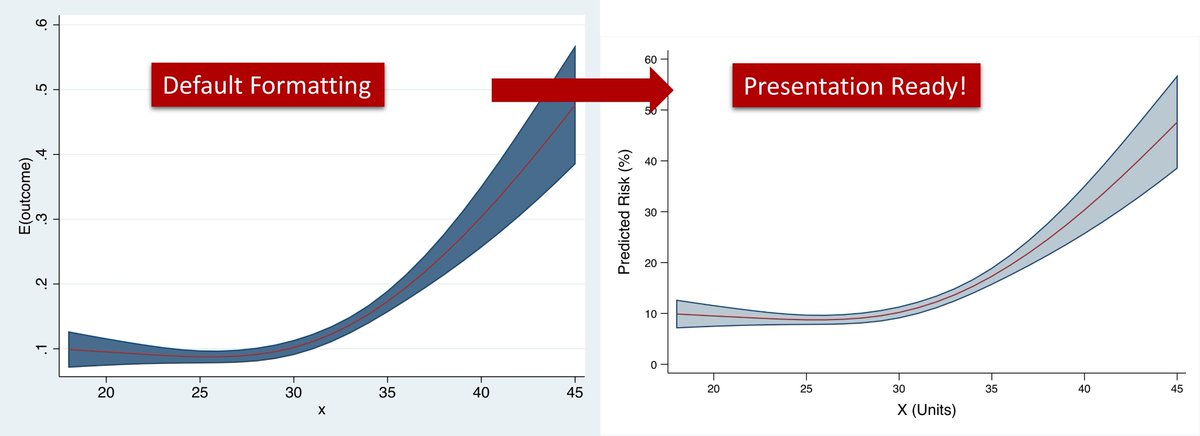
These options in #stata for making this graph presentation-ready!
adjustrcspline, link(logit) scheme(vg_palec) ///
ylabel(, nogrid angle(horizontal)) ///
xtitle("X (Units)", size(medium)) ytitle("Outcome Risk (%)", size(medium)) ///
graphregion(fcolor(white))

legend(row(1) col(2) order(2 "Estimated Risk" 1 "95% Confidence Intervals") size(small))
graphregion(color(white)) *Makes the background white
ylabel(, nogrid) *Takes away the default horizontal gridlines
I encourage #EpiTwitter and #StatsTwitter to join in the fun and give the #GiftOfCode by sharing examples of their favorite #DataViz options and tricks in #stata and #rstats!
🎁 🎁 🎁


