
,
20 tweets,
9 min read
Read on Twitter
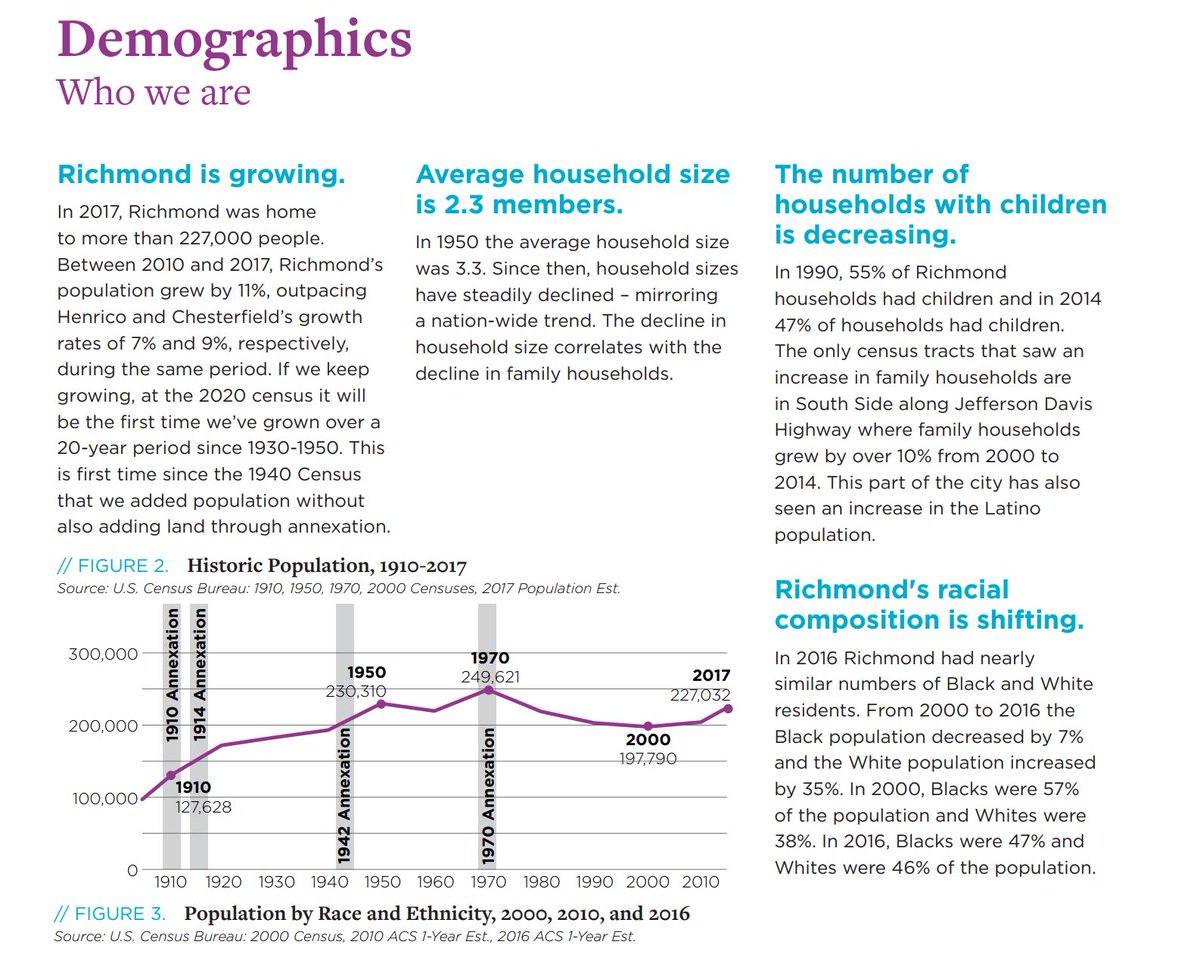
In #RVA: From 2000 to 2016 the Black population decreased by 7% and the White population increased by 35%. In 2000, Blacks were 57% of the population and Whites were 38%. In 2016, Blacks were 47% and Whites were 46% of the population. richmond300.com/sites/default/… 
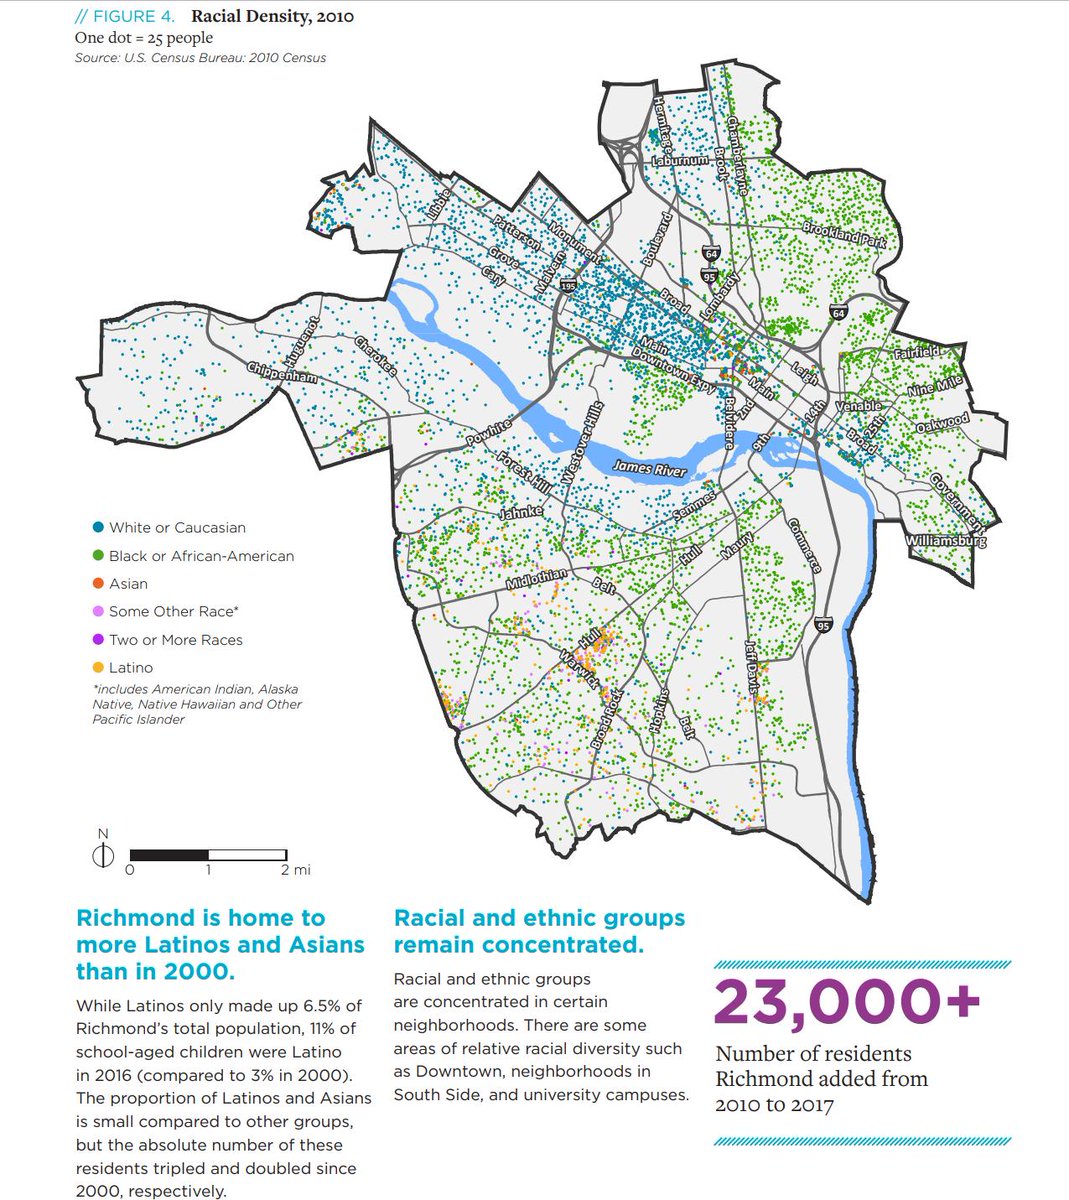
While the Latinx community only made up 6.5% of Richmond’s total population, 11% of school-aged children were Latinx in 2016 (compared to 3% in 2000).
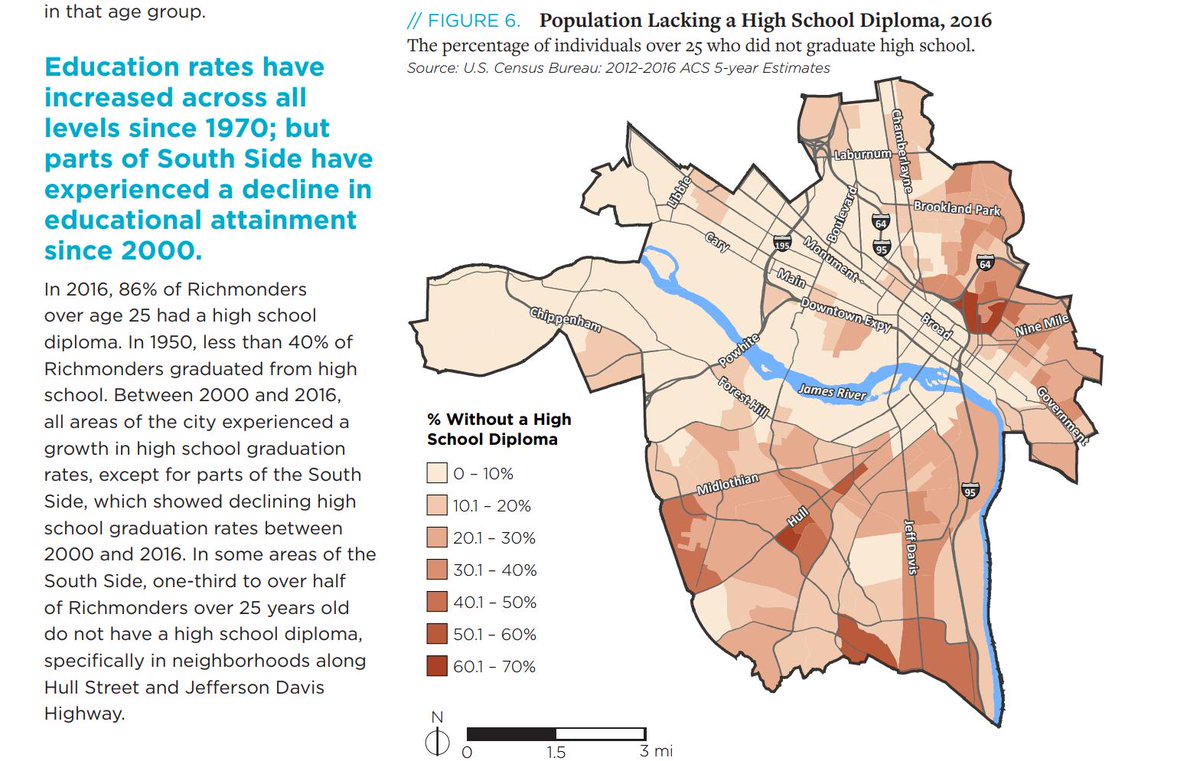
Between 2000 and 2016, all areas of #RVA experienced a growth in HS graduation rates, except for parts of Southside, which showed declining HS graduation rates. In areas of Southside, especially along Hull St and Jeff Davis Hwy, many residents over 25 don't have a HS diploma.
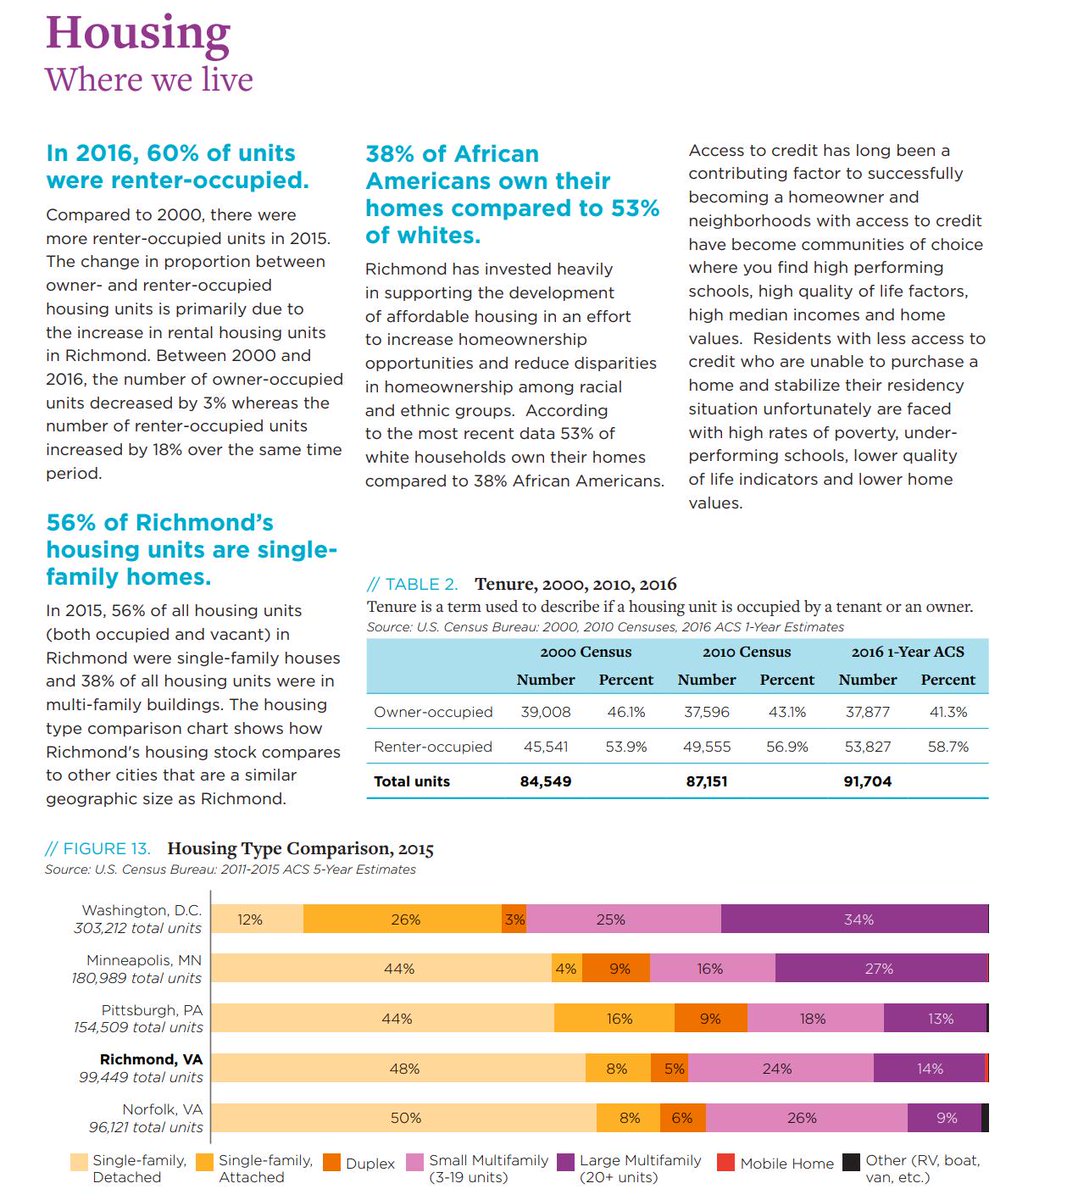
In #RVA, 53% of white households own their homes compared to 38% African Americans. This is due to certain residents having less access to credit. Neighborhoods w/access have high performing schools, quality of life, median incomes and home values.
The city is in need of affordable housing. Almost 35% of the city's households
earn less than $25,000 per year. Look at the number of residents that are spending anywhere between 31-49% of their income on housing. 22% of people spend half of their check on housing.
earn less than $25,000 per year. Look at the number of residents that are spending anywhere between 31-49% of their income on housing. 22% of people spend half of their check on housing.

VCU, MCV and RPS are Richmond's top three largest employers. Out
of the top 20 employers in the city, 11 are local, state, and/or federal organizations.
of the top 20 employers in the city, 11 are local, state, and/or federal organizations.

More than 200,000 meals are given to youth at Parks & Rec Facilities.
Also interesting to note that the areas of the city not within a 10-minute walk of a park are predominantly found in the Southside. Yeah...it's super obvious too.
Also interesting to note that the areas of the city not within a 10-minute walk of a park are predominantly found in the Southside. Yeah...it's super obvious too.

#RVA has 42 Friends of Parks groups and 34 community gardens.
I did not know that. Will add that to my to-do list.
I did not know that. Will add that to my to-do list.
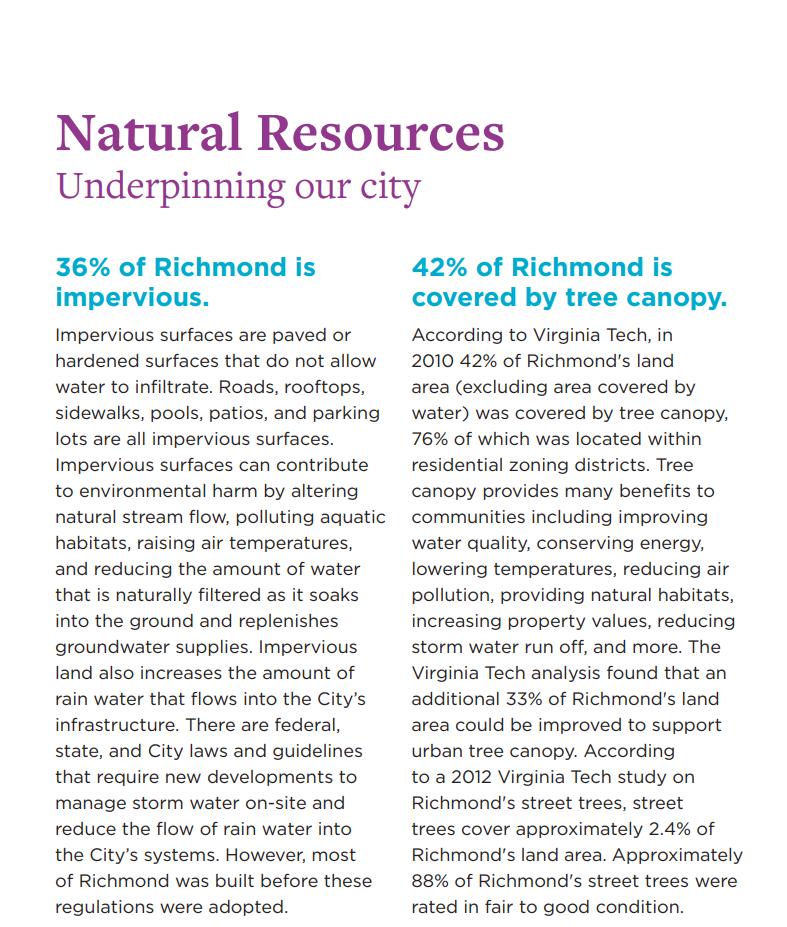
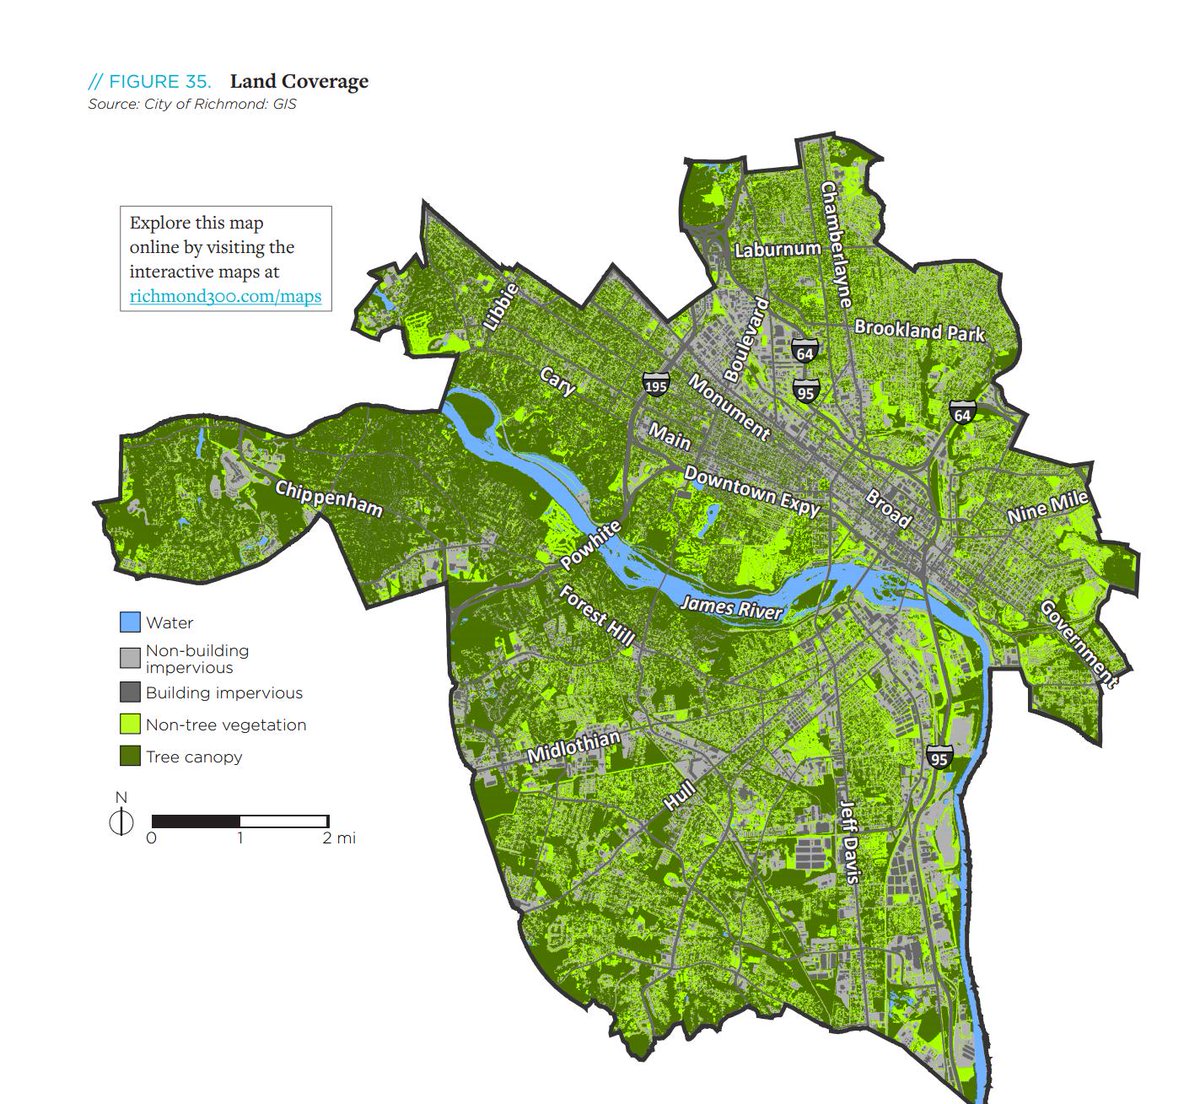
According to VT, 42% of #RVA is covered by tree canopy. BUT, only 2.4% are street trees. Which says to me that we have a high density in parks and certain high-income residential neighborhoods. Notice all of the impervious surfaces downtown and in Southside.
According to the @ScienceMusofVA, from 1948 to 2011, "Virginia saw a 33% increase in the frequency of extreme rainfall events and an 11% increase in the amount of rain falling in its largest annual storms."
(Remember, in Feb. the James River hit its highest level since 2010.)
(Remember, in Feb. the James River hit its highest level since 2010.)
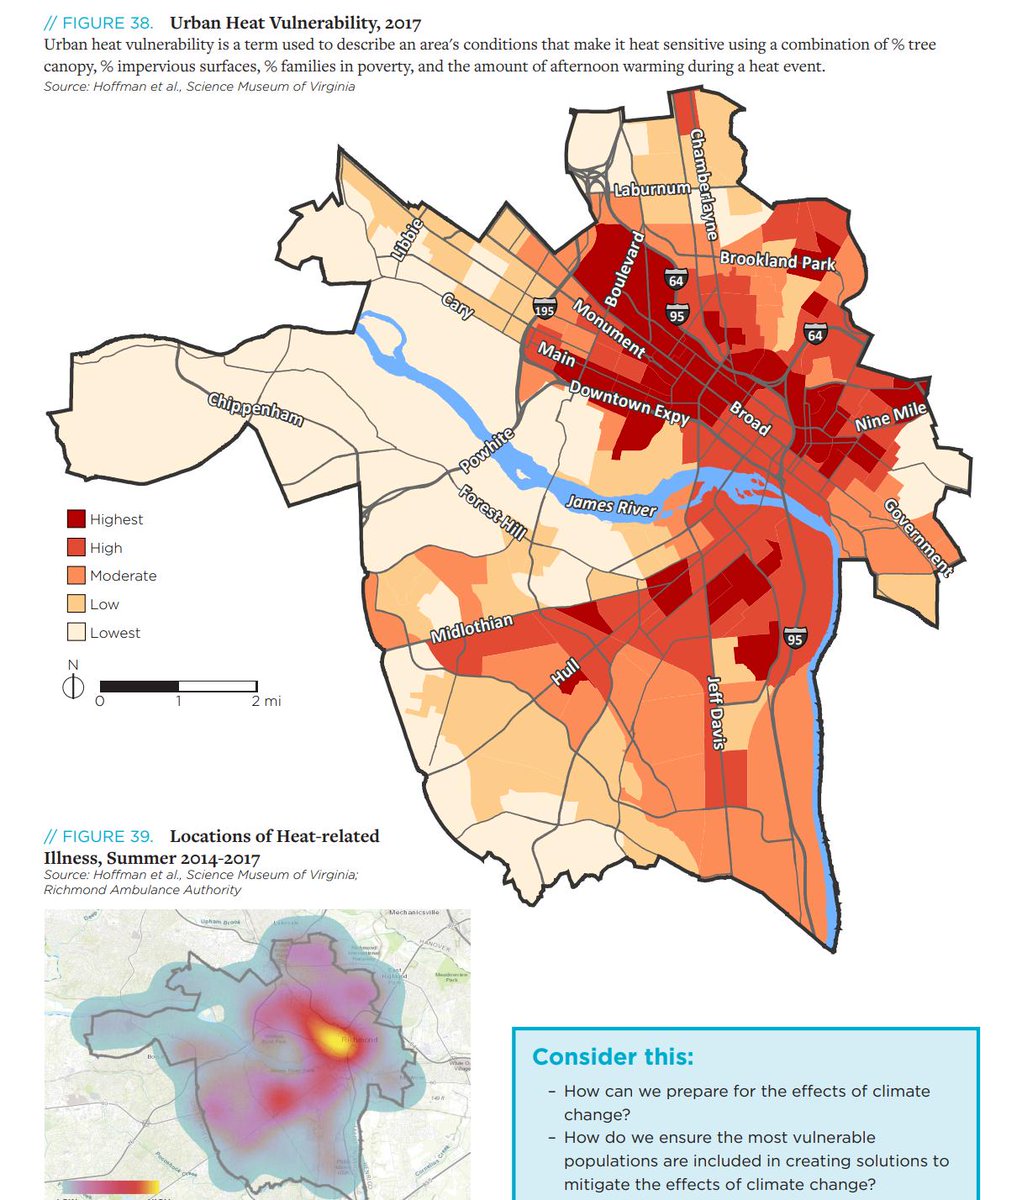
It's important to note the correlation in green spaces and areas with impervious surfaces when looking at the Urban Heat Islands in the city. This becomes a health issue. If you didn't know - #RVA is the #2 asthma capital in the U.S.
"Where you live in Richmond determines your health and life expectancy."
Y'all, these stats on health are just...
Y'all, these stats on health are just...
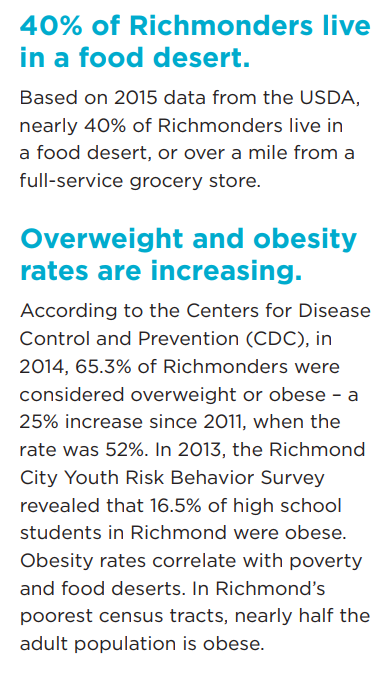
According to the CDC, 1 in 8 Richmonders have diabetes.
West End: Diabetes = 5%, Asthma = 7%
East End and Southside: Diabetes = 20+%, Asthma = 14%
*THIS IS ENVIRONMENTAL RACISM*
West End: Diabetes = 5%, Asthma = 7%
East End and Southside: Diabetes = 20+%, Asthma = 14%
*THIS IS ENVIRONMENTAL RACISM*
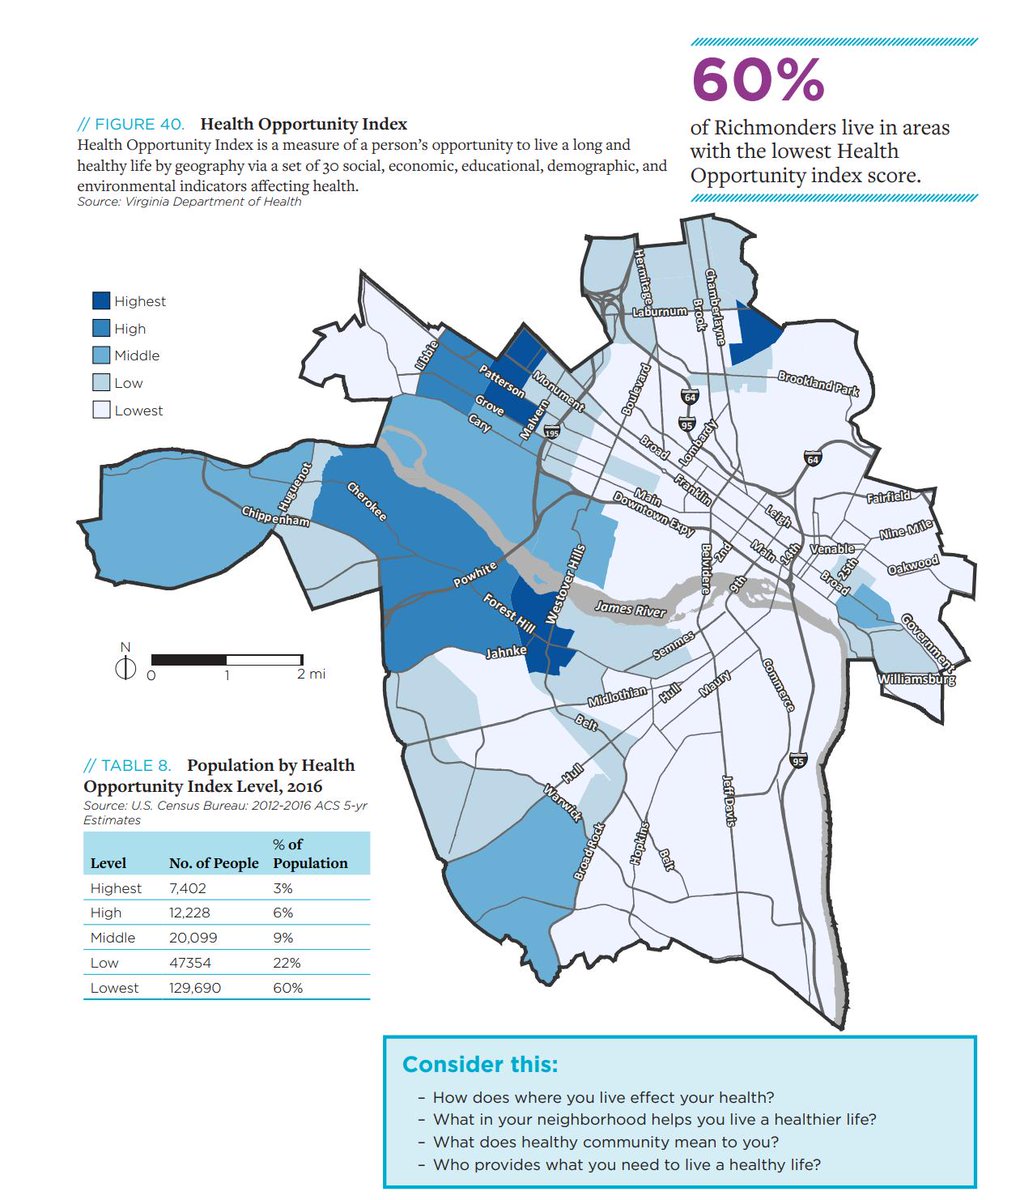
60% of #RVA live in areas with the lowest Health Opportunity index score.
Yep. Look at the East End and Southside.
Yep. Look at the East End and Southside.
But, there are LOTS of groups and individuals who are doing amazing work in the fight for racial, environmental, economic and food justice; especially in the East End and South Richmond. We'd need another report to highlight all of those folks.


Violent crime is highly concentrated and correlates directly to poverty. Neighborhoods that saw the most violent crime in 2016 are also the same areas that are most affected by poverty. 19 of the city's 148 neighborhoods had the highest number of total violent crimes in 2016.

The report does point out that the total number of violent crimes and property crimes has decreased since 2005, even while the city's population has grown by 25,000 residents.
There's a lot of great info the report covered as well on arts, tourism and the economy, so feel free to check it out at richmond300.com/sites/default/….
I am impressed with the team that put this report together. It's skimmable, nicely formatted and informative. Please use this as a reference for communications, advocacy and strategic work.


