My Authors
Read all threads
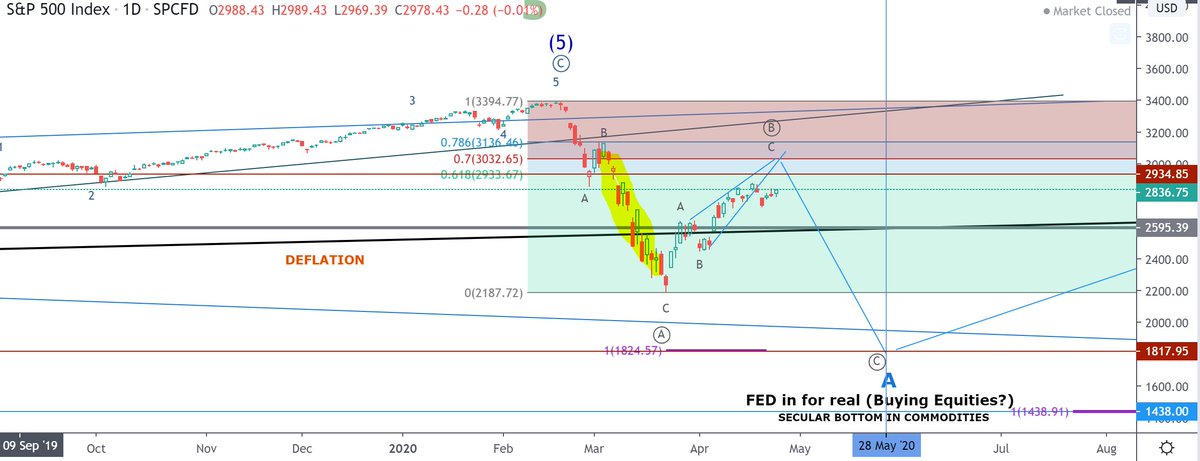
#SP500 Imo getting very close to start of next major decline! Chart difficult to read (sorry!). But so many lines in the sand here around 2920-2950 (on 4 hour chart). May over-shoot these levels -but soon major crash will set in. Illiquid deflation phase continues. Take care!! 🙏
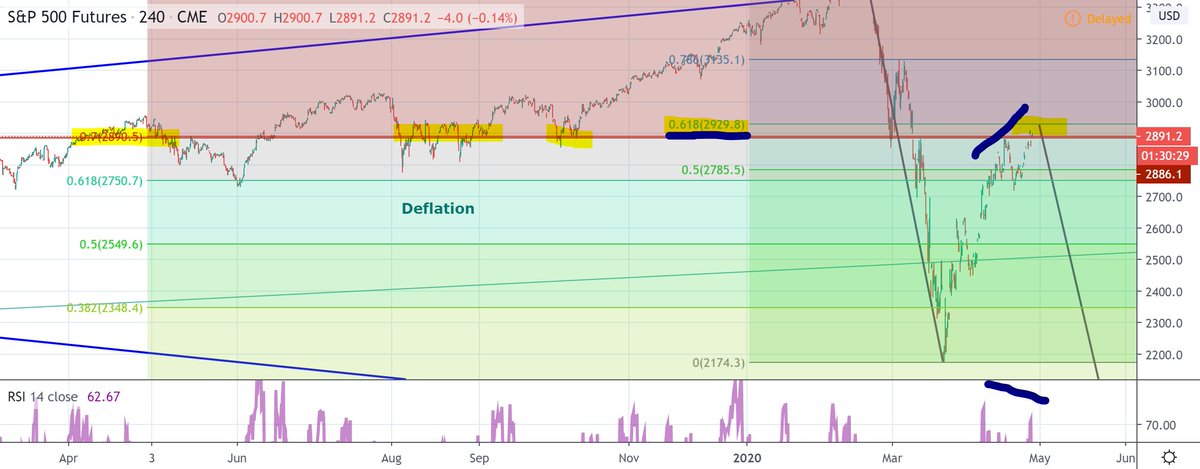
As we can expect A (circle) = C (circle) we may see next decline bottom out ~1700-1850-area = A (blue). Major deflationary bust about to play out. Take care!!
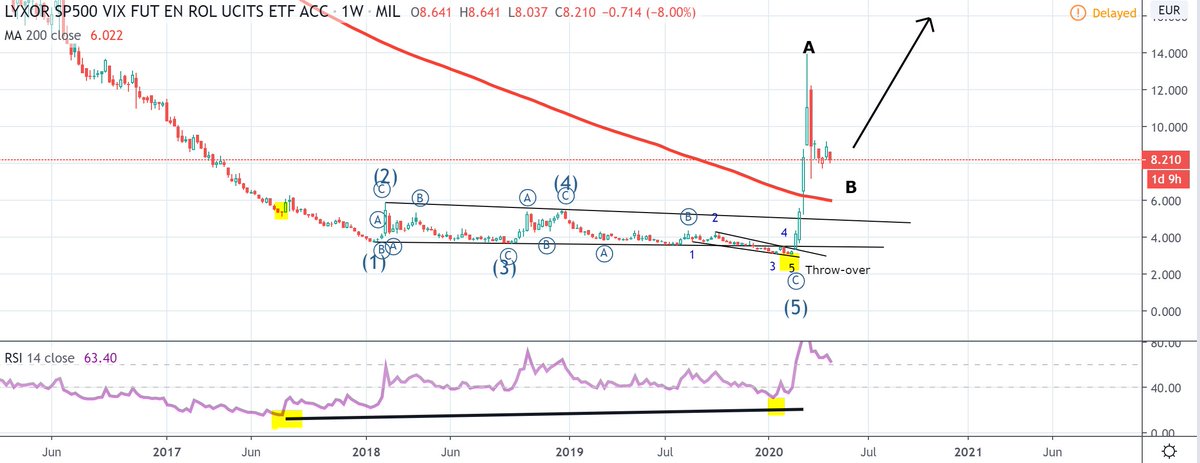
My VIX model which predicted explosion in #VIX tells me, that we are about to see even stronger phase. Nothing rallies or declines in straight line. Hence, we currently see correction wave B - before strong take off in wave C. 2½ yrs of RSI divergence is not solved in 1 blow-up!
Missing some Tweet in this thread? You can try to force a refresh.

Enjoying this thread?

Keep Current with Henrik Zeberg

Profile picture

Stay in touch and get notified when new unrolls are available from this author!

Read all threads

This Thread may be Removed Anytime!

Twitter may remove this content at anytime, convert it as a PDF, save and print for later use!

Try unrolling a thread yourself!

how to unroll video

1) Follow Thread Reader App on Twitter so you can easily mention us!

2) Go to a Twitter thread (series of Tweets by the same owner) and mention us with a keyword "unroll" @threadreaderapp unroll

You can practice here first or read more on our help page!

Follow Us on Twitter!

Did Thread Reader help you today?

Support us! We are indie developers!


This site is made by just two indie developers on a laptop doing marketing, support and development! Read more about the story.

Become a Premium Member ($3.00/month or $30.00/year) and get exclusive features!

Become Premium

Too expensive? Make a small donation by buying us coffee ($5) or help with server cost ($10)

Donate via Paypal Become our Patreon

Thank you for your support!