
THREAD
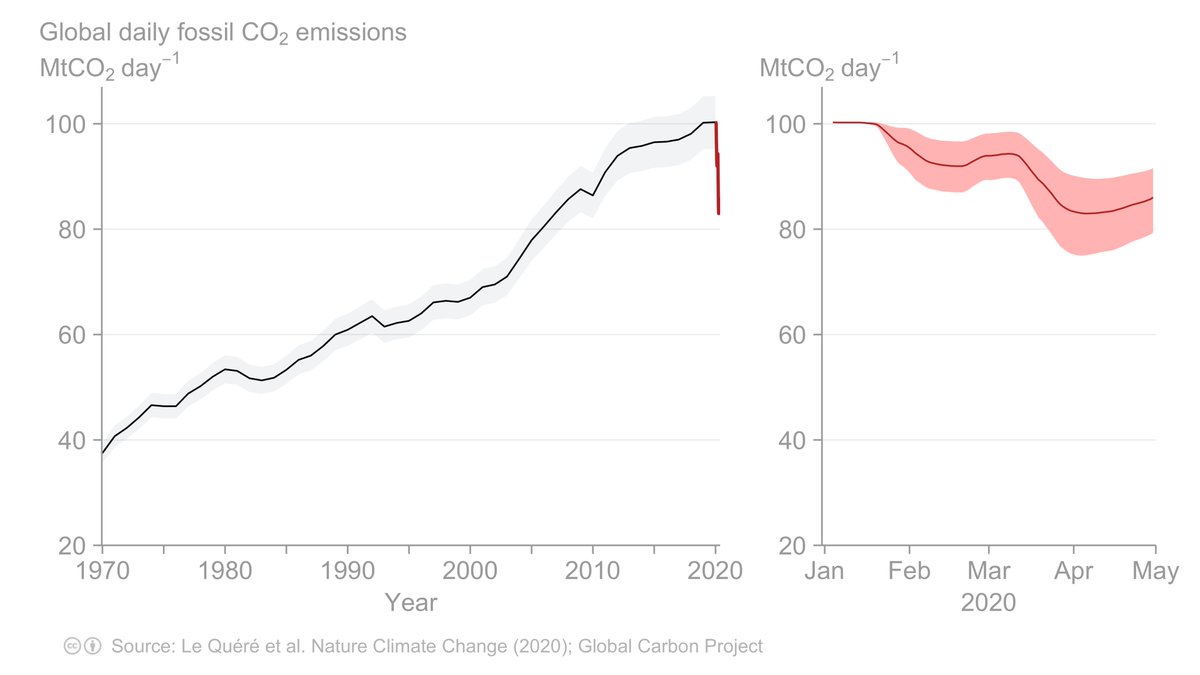
So, our @NatureClimate paper was released today and the world knows a lot more about the global impacts of #covid-19 #lockdown on daily #CO2 emissions. @clequere @Peters_Glen @PFriedling
But how has lockdown impacted #emissions in individual countries?
So, our @NatureClimate paper was released today and the world knows a lot more about the global impacts of #covid-19 #lockdown on daily #CO2 emissions. @clequere @Peters_Glen @PFriedling
But how has lockdown impacted #emissions in individual countries?
2/
The reductions in global emissions during January and February were driven by lockdown in China, the ‘epicentre’ of the virus outbreak.
International expansion of confinement measures led to deeper emissions cuts in March and April.
The reductions in global emissions during January and February were driven by lockdown in China, the ‘epicentre’ of the virus outbreak.
International expansion of confinement measures led to deeper emissions cuts in March and April.

3/
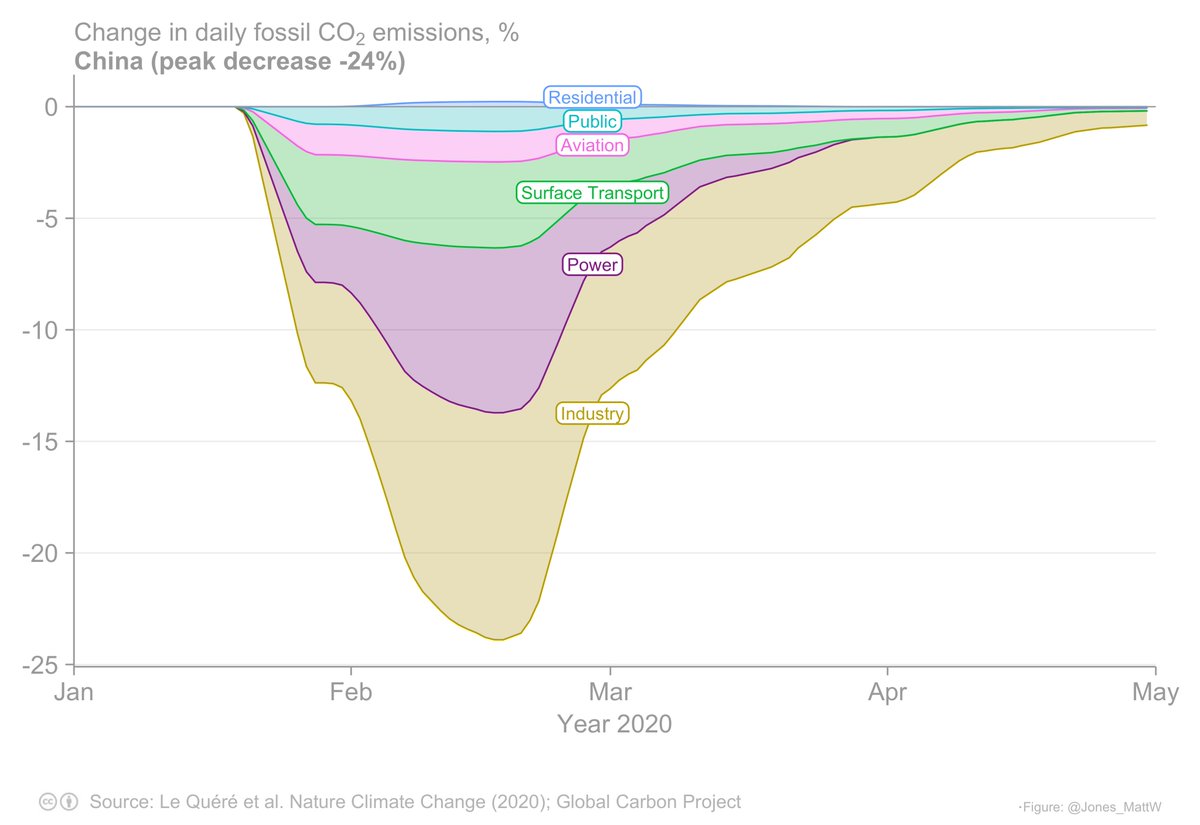
The total decrease in emissions reached ~25% in China and India. About two-thirds of the peak reductions were caused by retractions in the industry and power sectors.
The total decrease in emissions reached ~25% in China and India. About two-thirds of the peak reductions were caused by retractions in the industry and power sectors.

4/
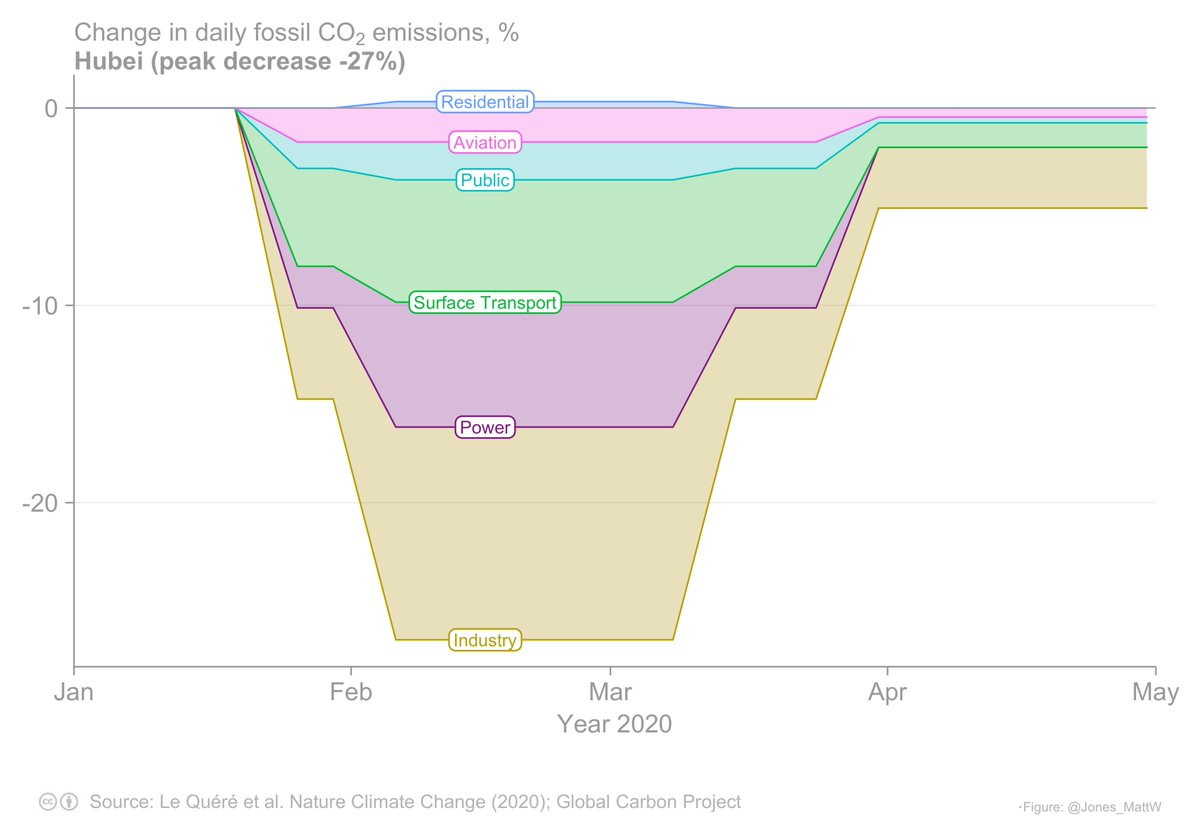
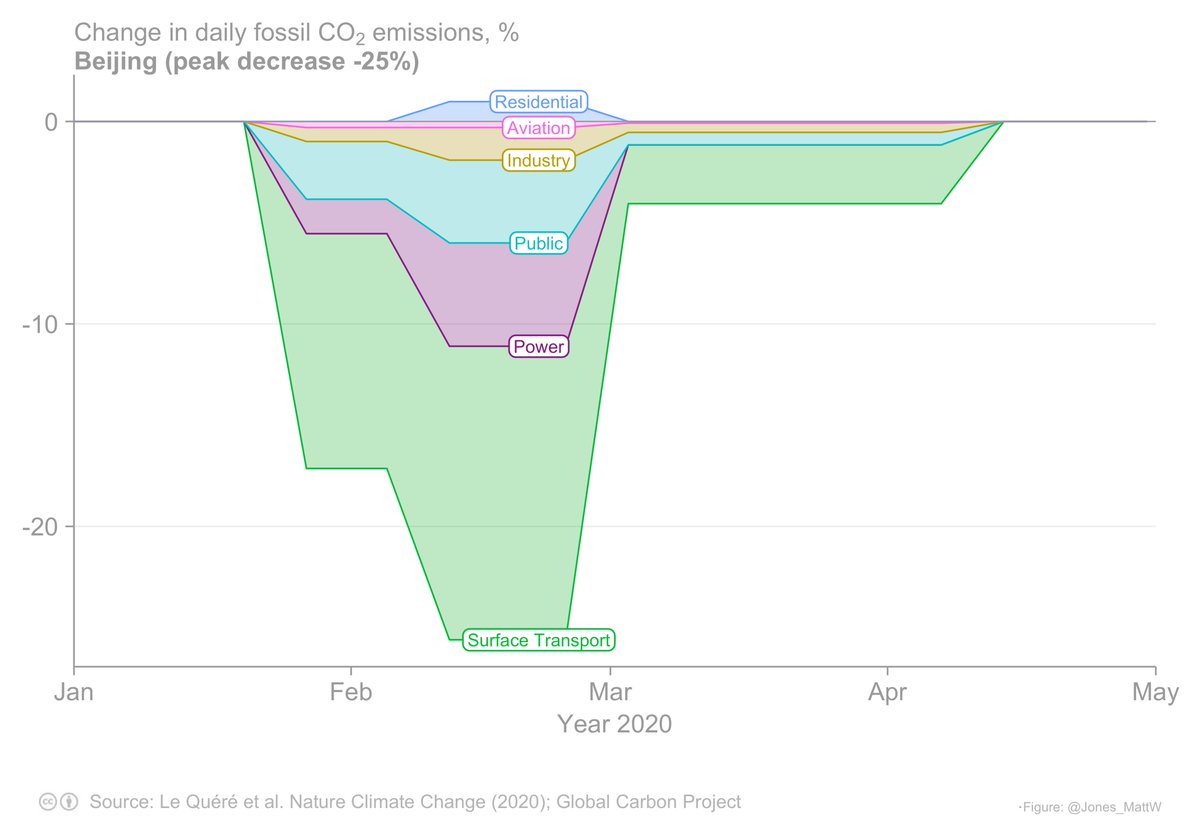
The fall in emissions was recorded earliest in Hubei (inc. Wuhan) and nearby provinces and spread across China.
The sectoral breakdown of the emissions reductions varied across the provinces.
See plots for each Chinese province at mattwjones.co.uk/covid-19/
The fall in emissions was recorded earliest in Hubei (inc. Wuhan) and nearby provinces and spread across China.
The sectoral breakdown of the emissions reductions varied across the provinces.
See plots for each Chinese province at mattwjones.co.uk/covid-19/
5/
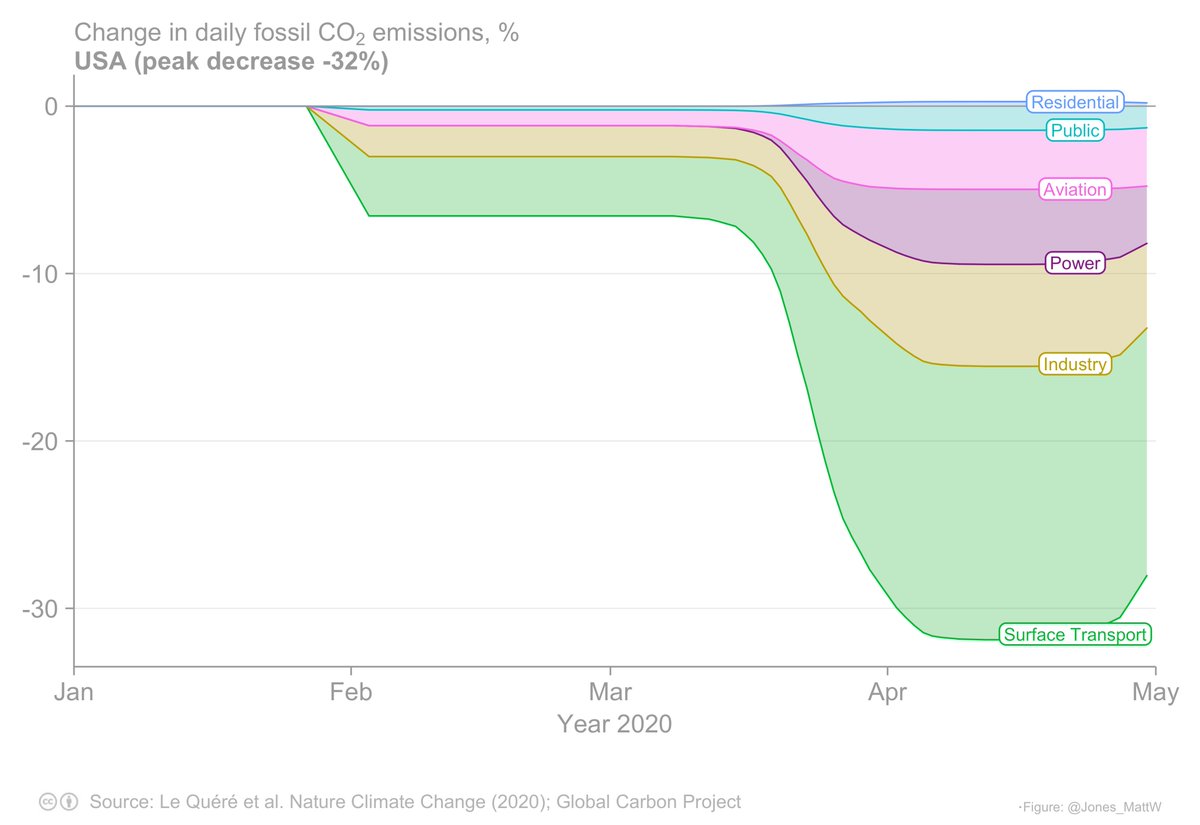
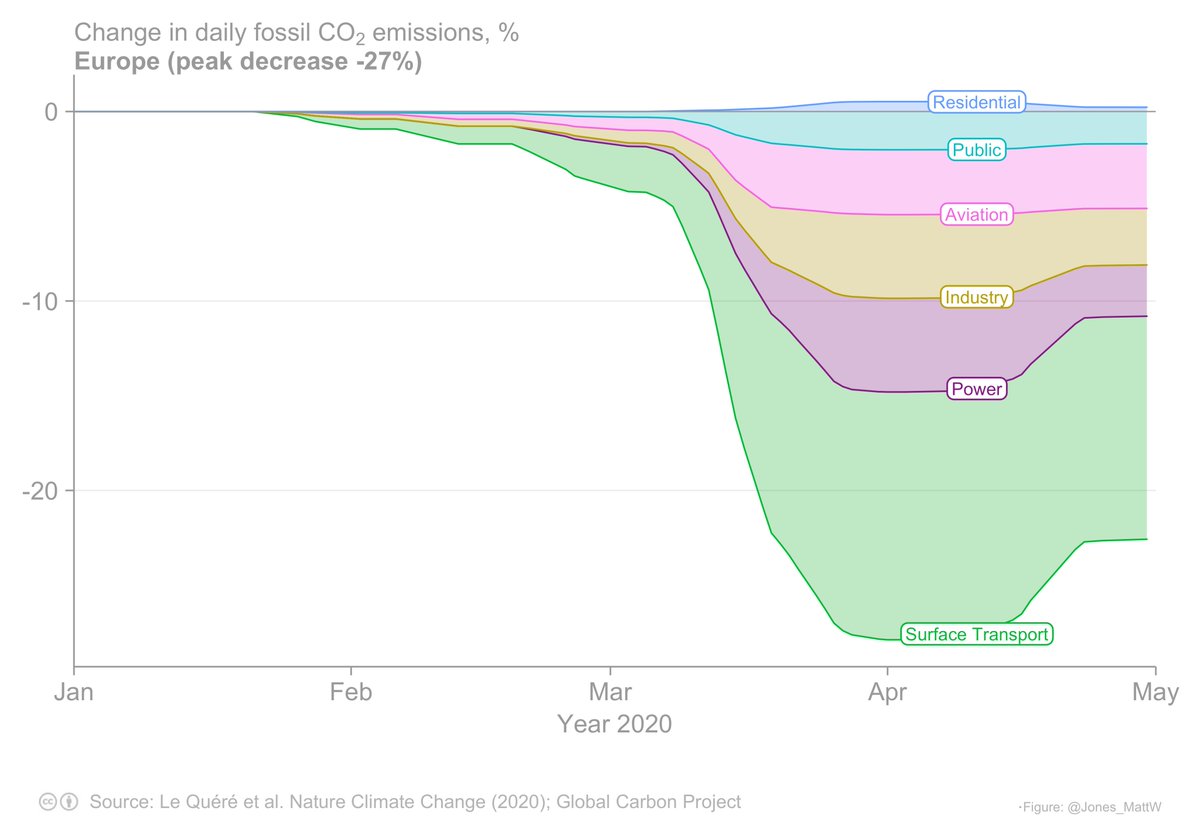
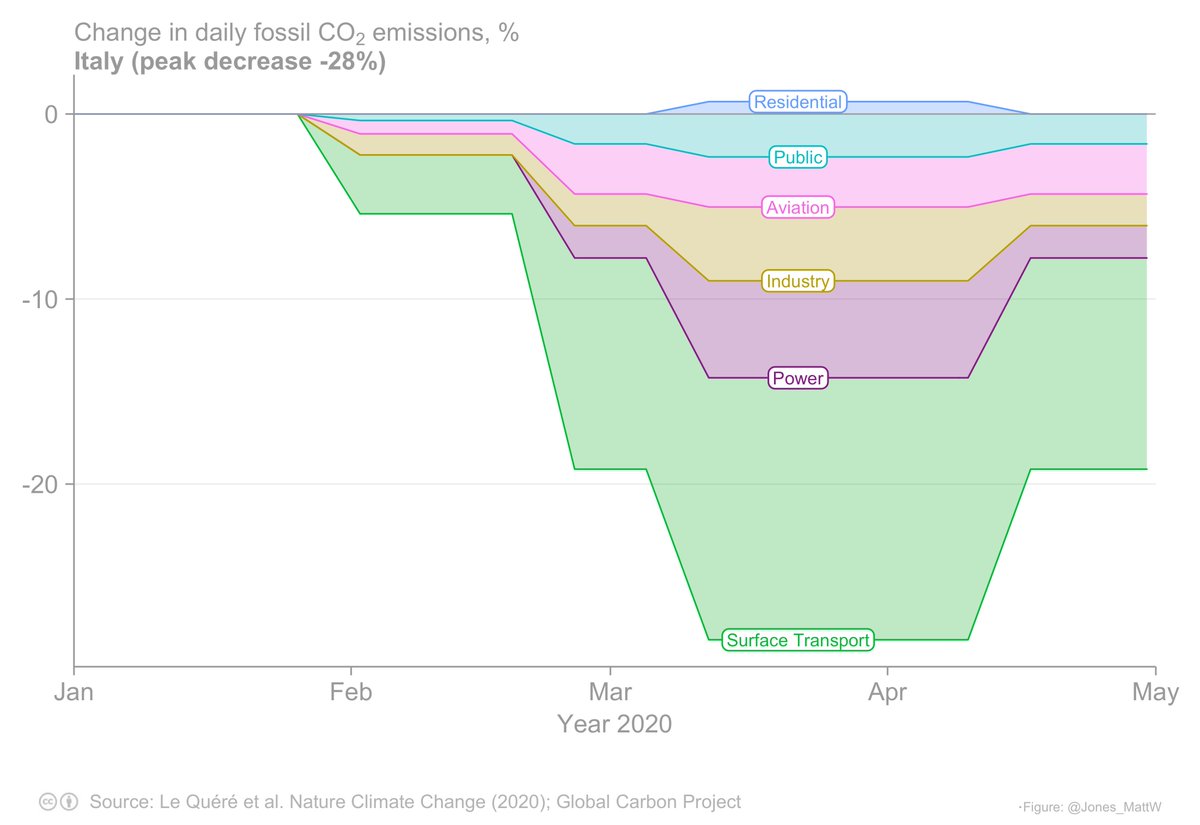
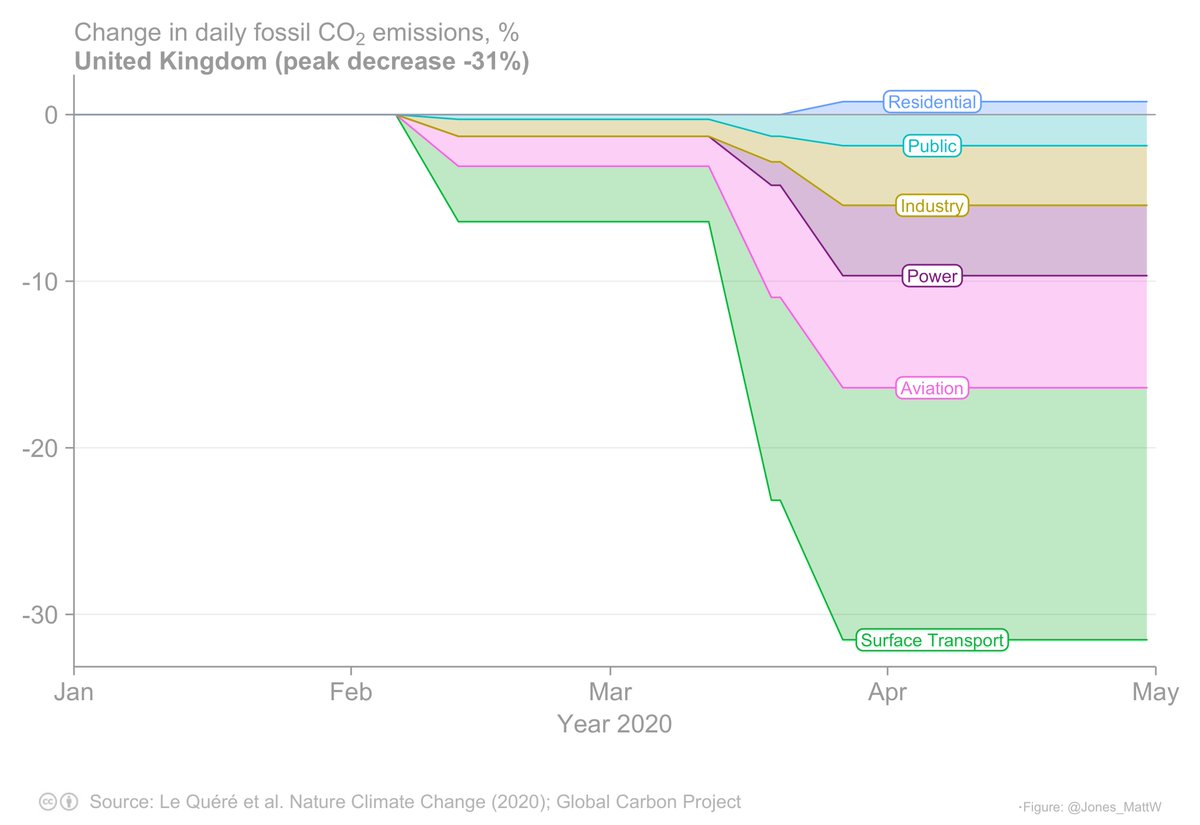
In the USA and Europe, reductions in travel accounted for about half of the total reduction in emissions. The peak reduction occurred in April and reached about 30%.
In the USA and Europe, reductions in travel accounted for about half of the total reduction in emissions. The peak reduction occurred in April and reached about 30%.
6/
The key differences in the 'top 4 emitters'?: reduced travel was more impactful in the US and Europe; reduced industry and power use were more impactful in China and India.
*Relative* reductions in emission were a little higher in 'the west' - particularly in the US.
The key differences in the 'top 4 emitters'?: reduced travel was more impactful in the US and Europe; reduced industry and power use were more impactful in China and India.
*Relative* reductions in emission were a little higher in 'the west' - particularly in the US.
7/
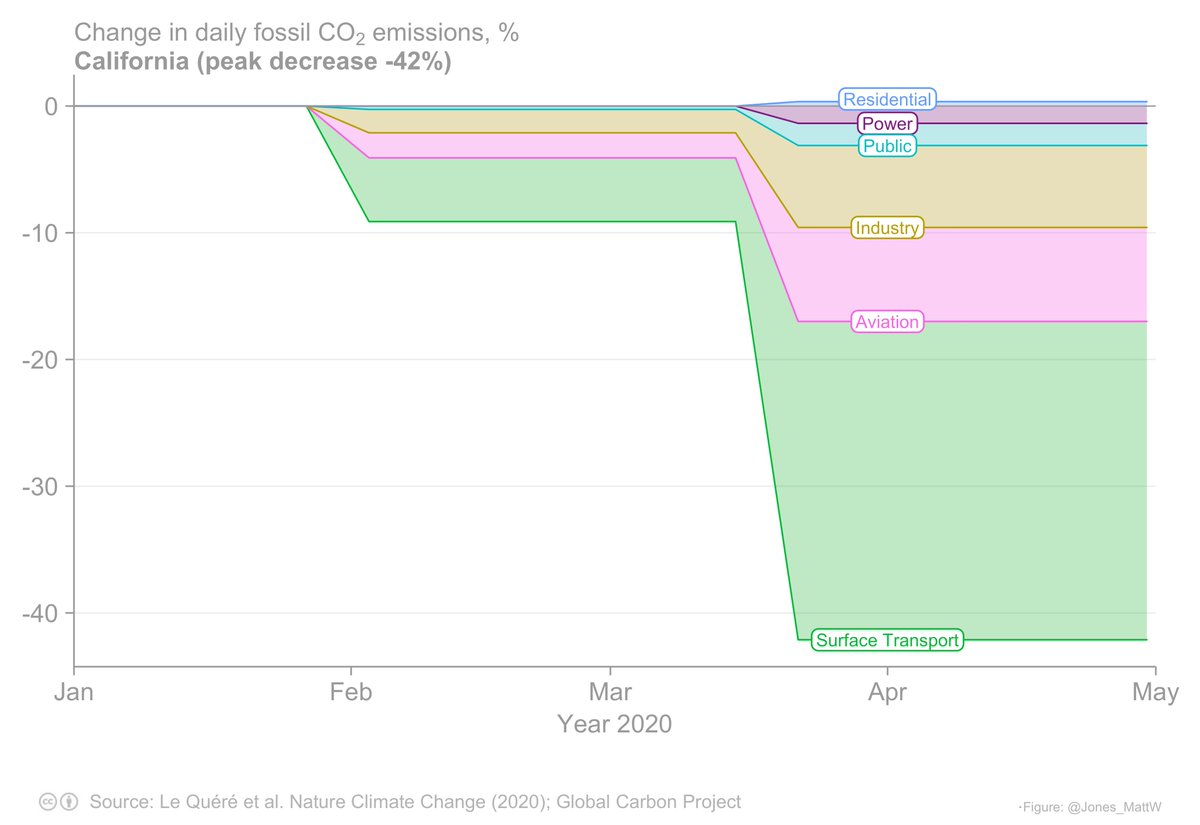
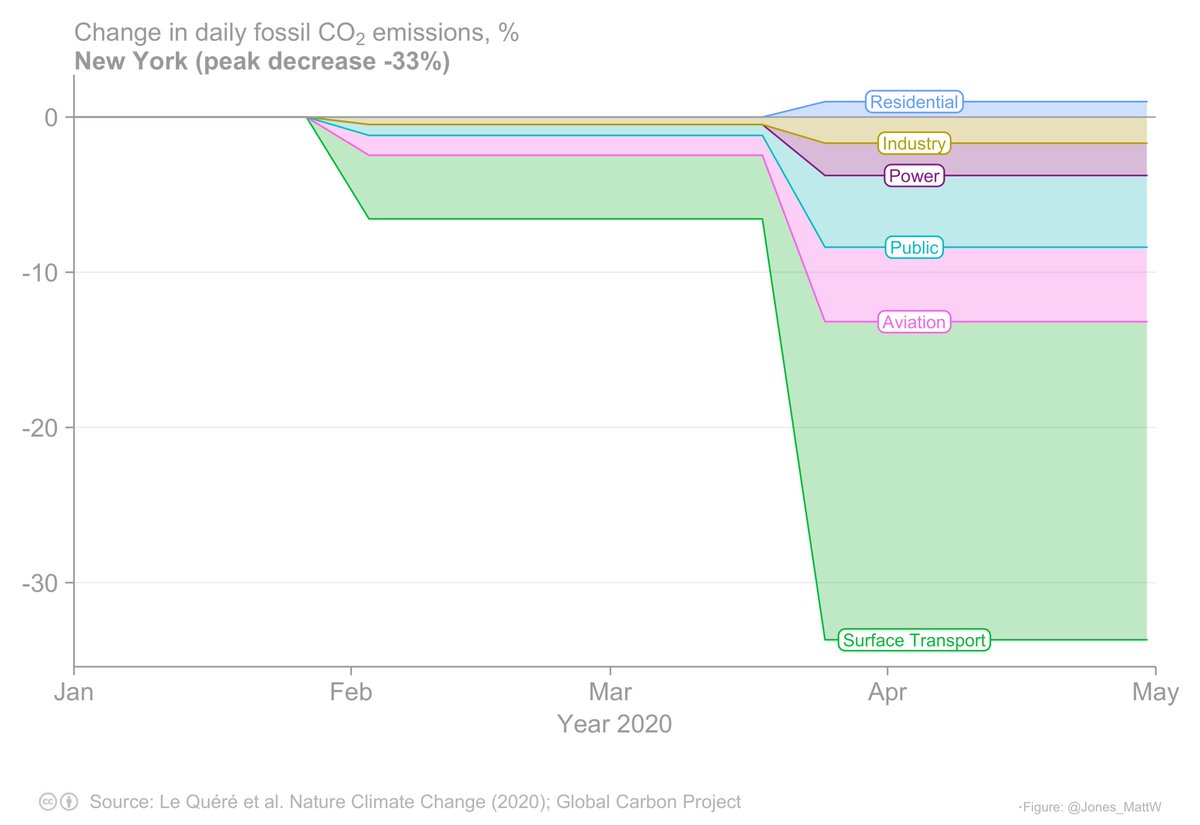
Within the US, emissions fell particularly sharply in California and Washington, and emissions tended to be affected most in the coastal states.
See plots for each US State at mattwjones.co.uk/covid-19/
Within the US, emissions fell particularly sharply in California and Washington, and emissions tended to be affected most in the coastal states.
See plots for each US State at mattwjones.co.uk/covid-19/
8/
The timing, magnitude and sectoral breakdown of emissions reductions also varied across Europe - we have plots for all EU27 member states and the UK.
The timing, magnitude and sectoral breakdown of emissions reductions also varied across Europe - we have plots for all EU27 member states and the UK.
9/
These plots paint a picture of the impacts of #lockdown on #emissions in individual countries and sectors, providing insight beyond the global headlines. Check out our catalog of plots for 68 countries: mattwjones.co.uk/covid-19.
@clequere @Peters_Glen @PFriedling @pepcanadell
These plots paint a picture of the impacts of #lockdown on #emissions in individual countries and sectors, providing insight beyond the global headlines. Check out our catalog of plots for 68 countries: mattwjones.co.uk/covid-19.
@clequere @Peters_Glen @PFriedling @pepcanadell
10/
Such a pleasure to contribute to this study as part of a big effort by many colleagues @adam_smith81 @ajdegol @robbie_andrew @efesce @gcarbonproject @TyndallCentre @uniofeastanglia.
Thanks to funders @V_ERIFY_H2020 and @che_project for supporting this work @EU_H2020.
Such a pleasure to contribute to this study as part of a big effort by many colleagues @adam_smith81 @ajdegol @robbie_andrew @efesce @gcarbonproject @TyndallCentre @uniofeastanglia.
Thanks to funders @V_ERIFY_H2020 and @che_project for supporting this work @EU_H2020.
Rookie error - I got a bit too excited and forgot to include a link to our article!
"Temporary reduction in daily global CO2 emissions during the COVID-19 forced confinement"
nature.com/articles/s4155…
"Temporary reduction in daily global CO2 emissions during the COVID-19 forced confinement"
nature.com/articles/s4155…

